A Free .NET Profiler for VS Code: CPU, Memory and Leaks in C# and F#
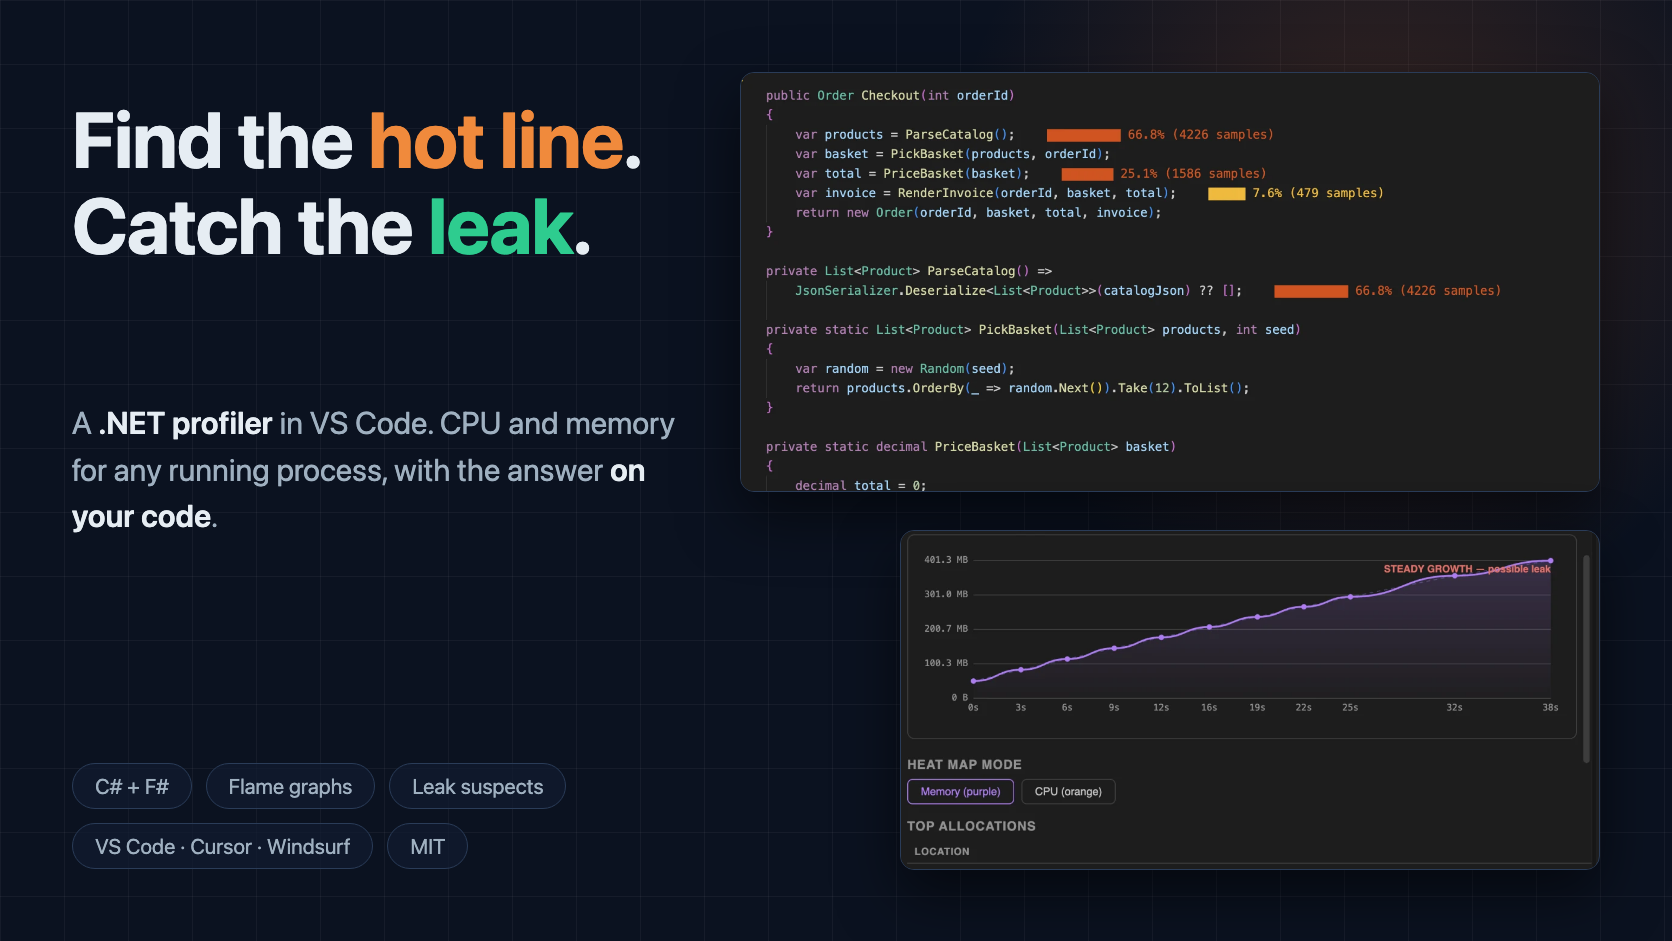
Your app is slow, or its memory keeps climbing. SharpLsp now profiles CPU and memory for any running .NET process without leaving VS Code, and it puts the answer on the line of code that caused it.

SharpLsp Team
October 17, 2026
8 min read