A Free .NET Profiler for VS Code: CPU, Memory and Leaks in C# and F#

SharpLsp Team
Nimblesite Engineering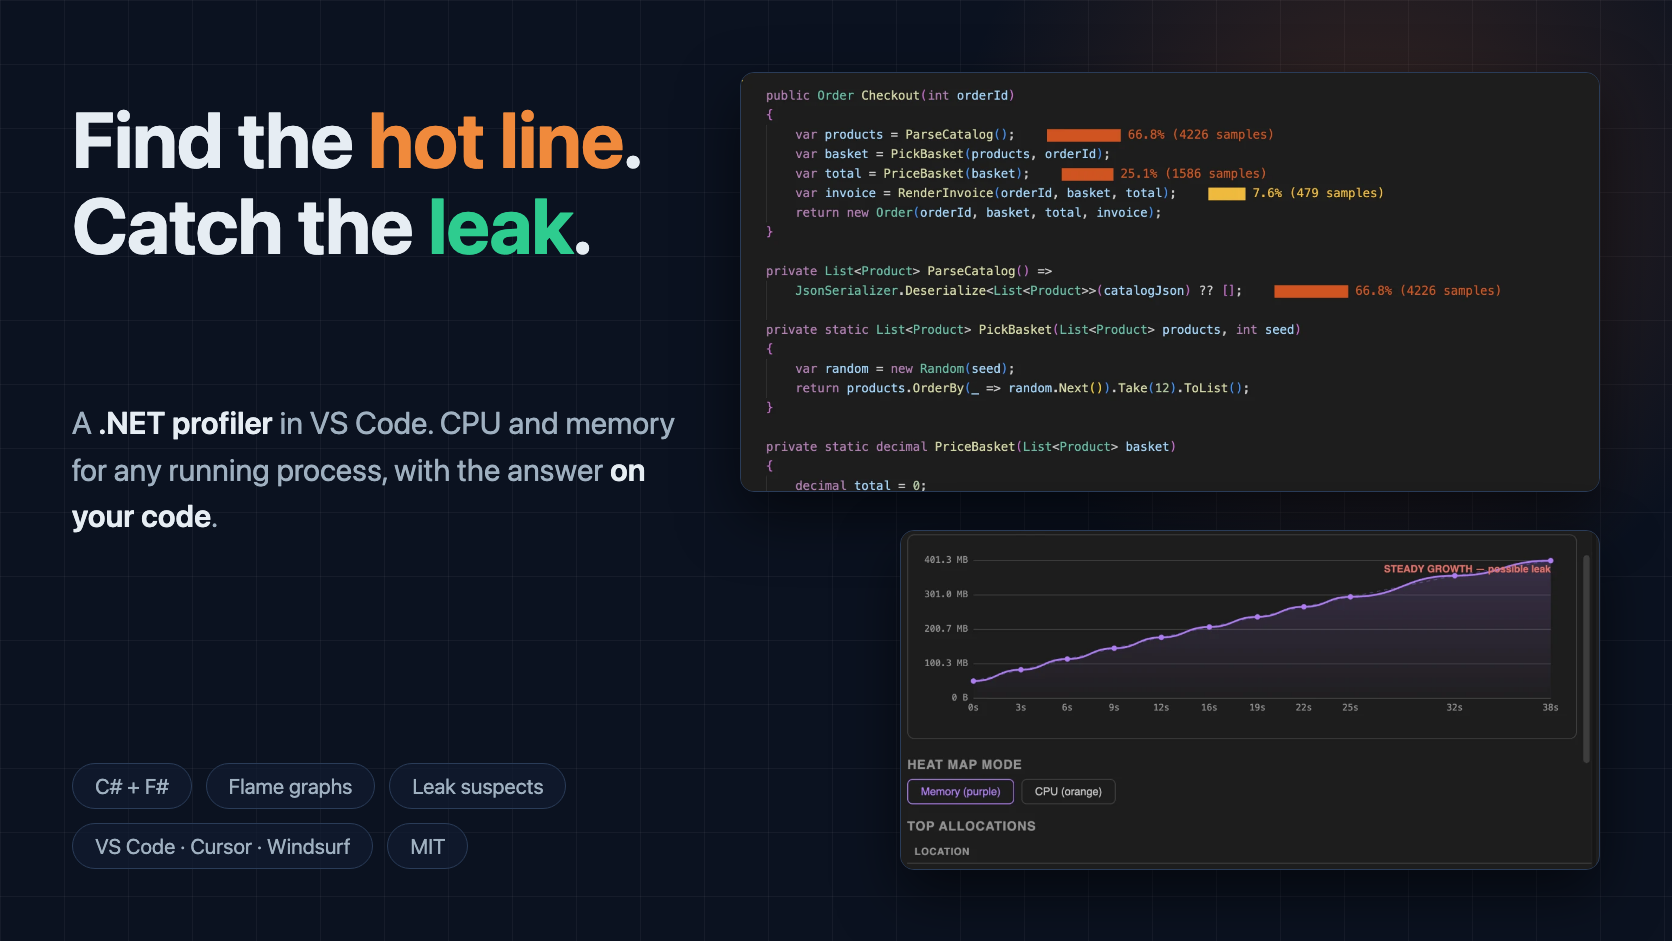
Every .NET app gets slow eventually, or starts holding on to memory it should have let go. Finding out why has usually meant leaving VS Code. You could open Visual Studio's profiler on Windows, buy dotTrace and dotMemory, or record a trace on the command line and read it in another tool.
SharpLsp's profiler does the job where you write the code. It profiles CPU and memory for any running .NET process. It puts the hot lines and the leak suspects on your source. It is MIT-licensed and needs no account. Here it is in one minute:
Start from the symptom
Nobody starts the day wanting a profiler. You start with a fan that won't stop, a request that takes four seconds, a high CPU usage alert, or a container that runs out of memory every night. At that point you don't know which process is the problem, let alone which line.
So the profiler starts there too. The Processes view in the SharpLsp sidebar lists every .NET process on the machine with its PID, runtime, live CPU and memory. The process burning a core, or growing without bound, stands out before you profile anything. Processes from your open workspace are highlighted.
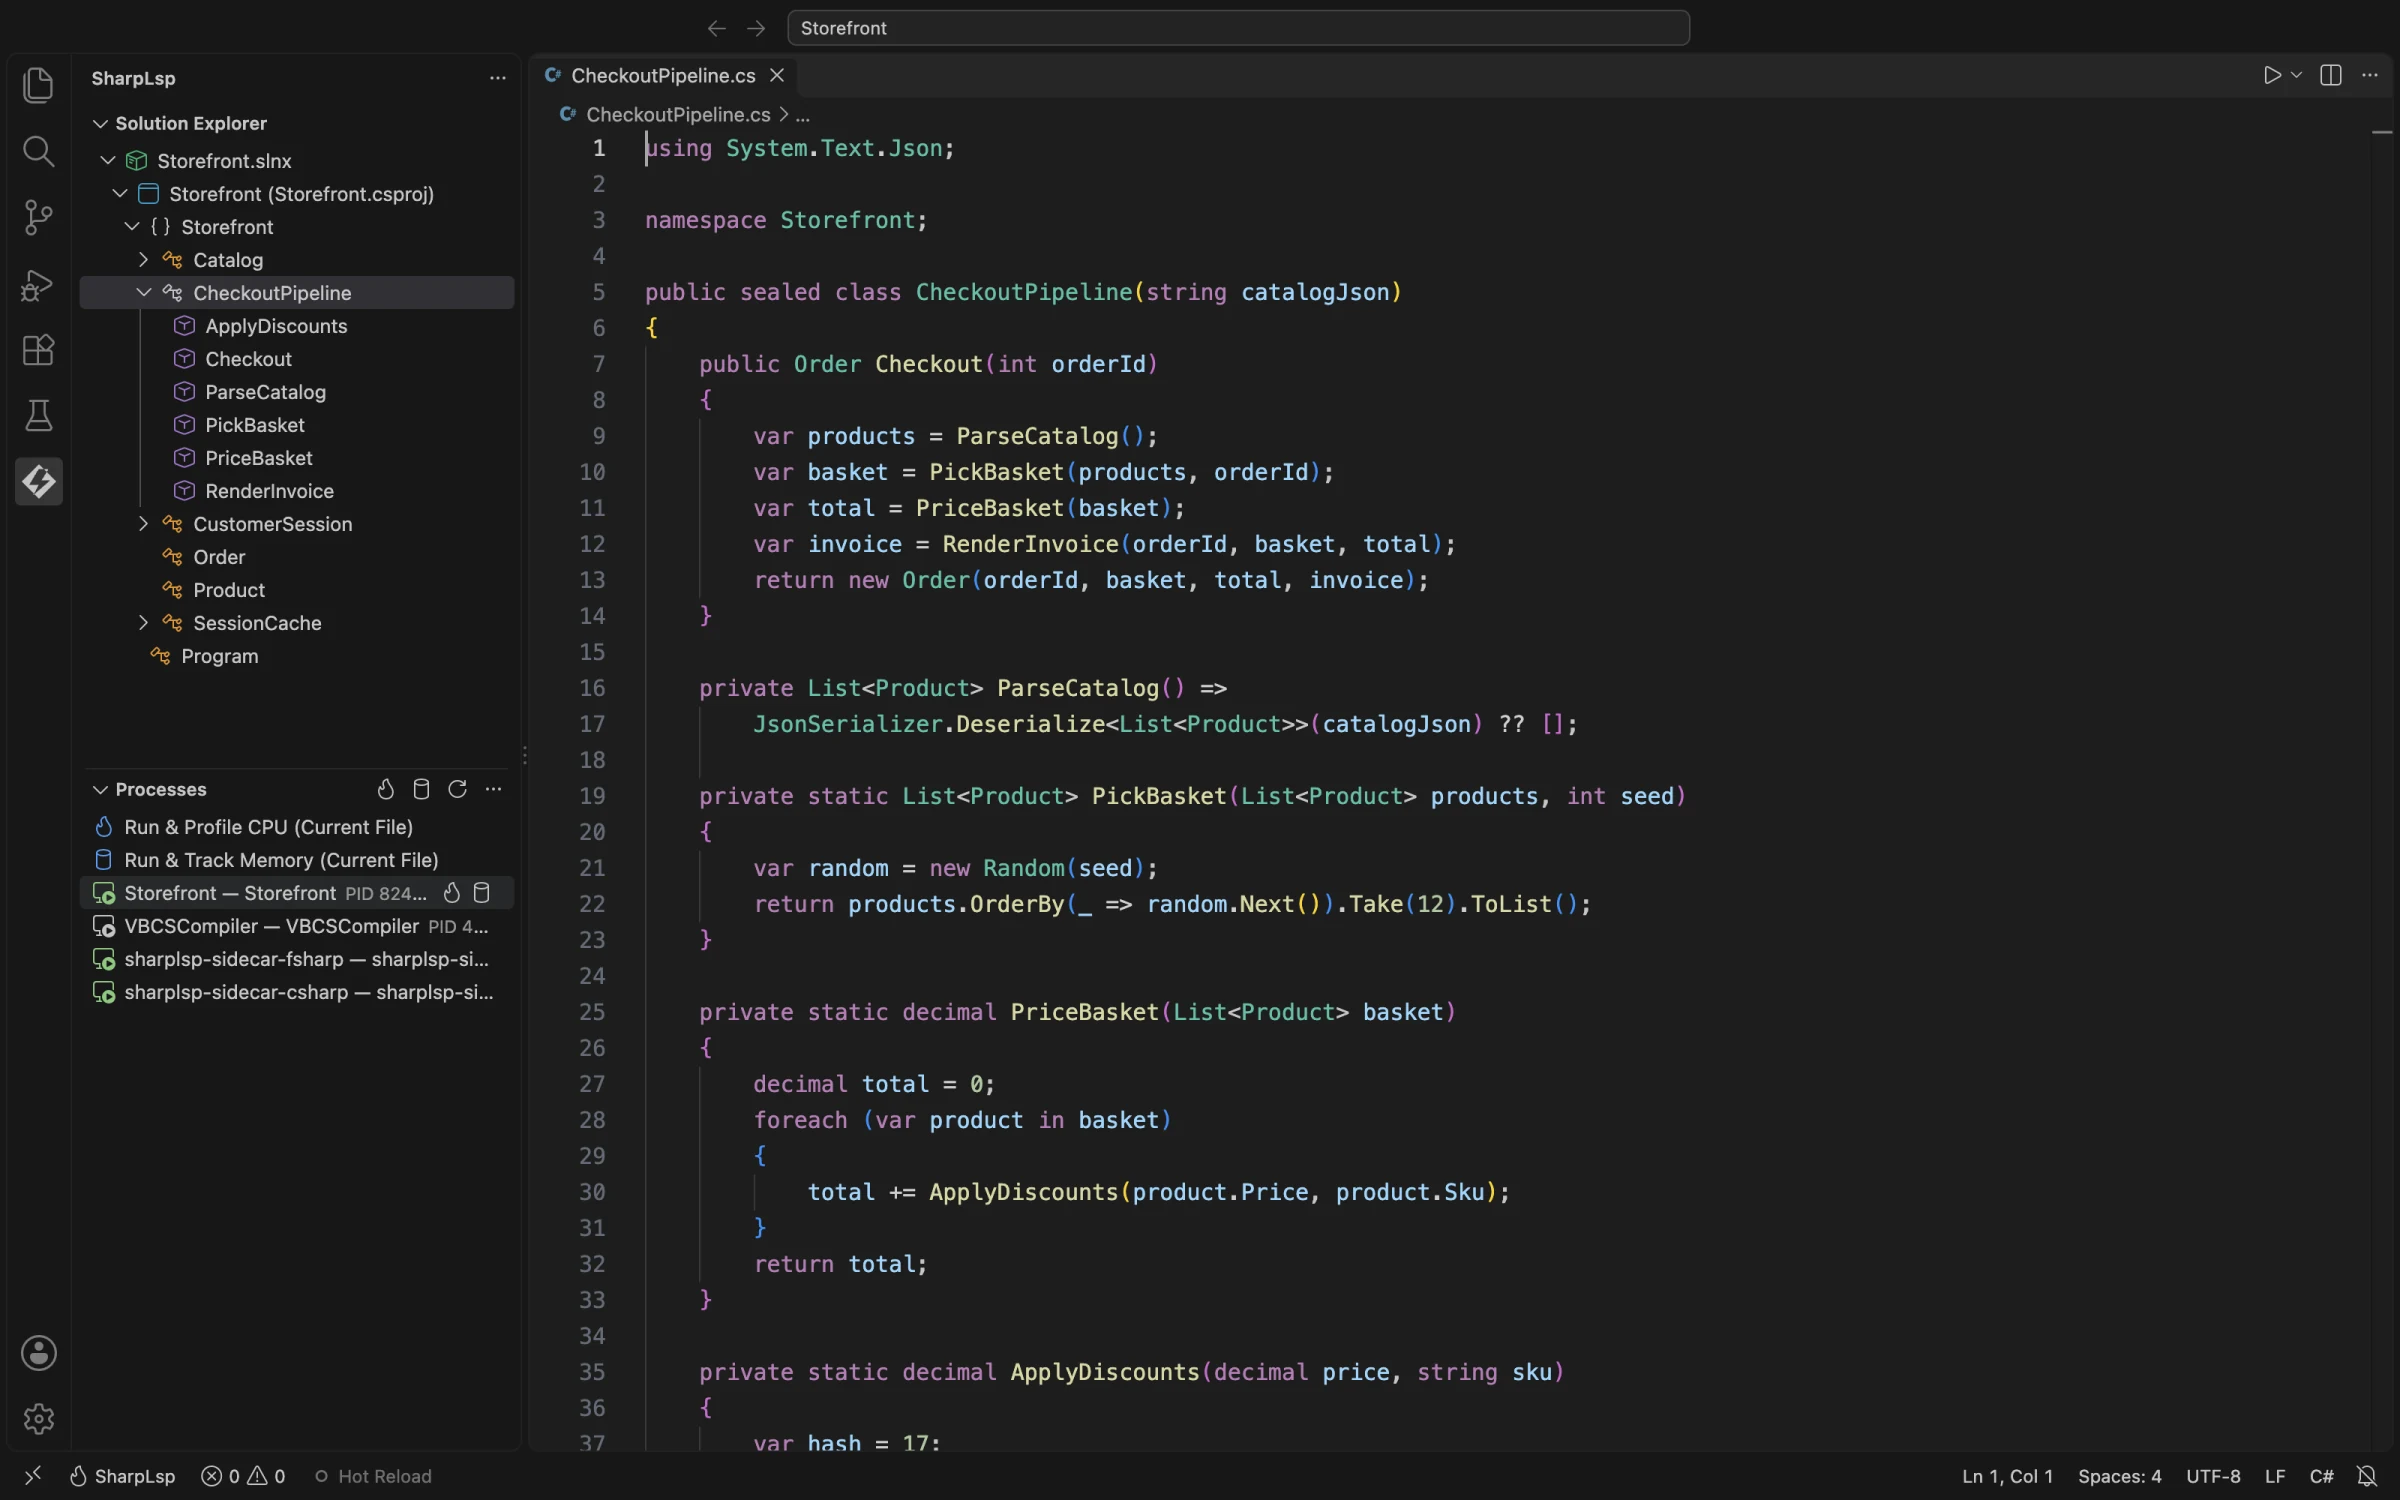
Hover a row and click Profile CPU or Track Memory. If the problem shows up at startup, Run & Profile CPU (Current File) launches the project under the SharpLsp debugger and profiles it from launch.
CPU profiling: the hot line, not just the hot method
This recording is unedited and in real time:
The sampler attaches through EventPipe, the runtime's own diagnostics channel. It samples at 100 Hz by default. It works on a process that is already running, so you don't restart the app, rebuild it or add a package. Low-overhead sampling is how profilers in other ecosystems work too, such as py-spy for Python and async-profiler for Java. .NET developers should have the same thing in their editor.
Stop the session and the results land in your code. Every hot line gets an inline heat bar with its share of the samples, and the overview ruler marks each one so you can jump to it:
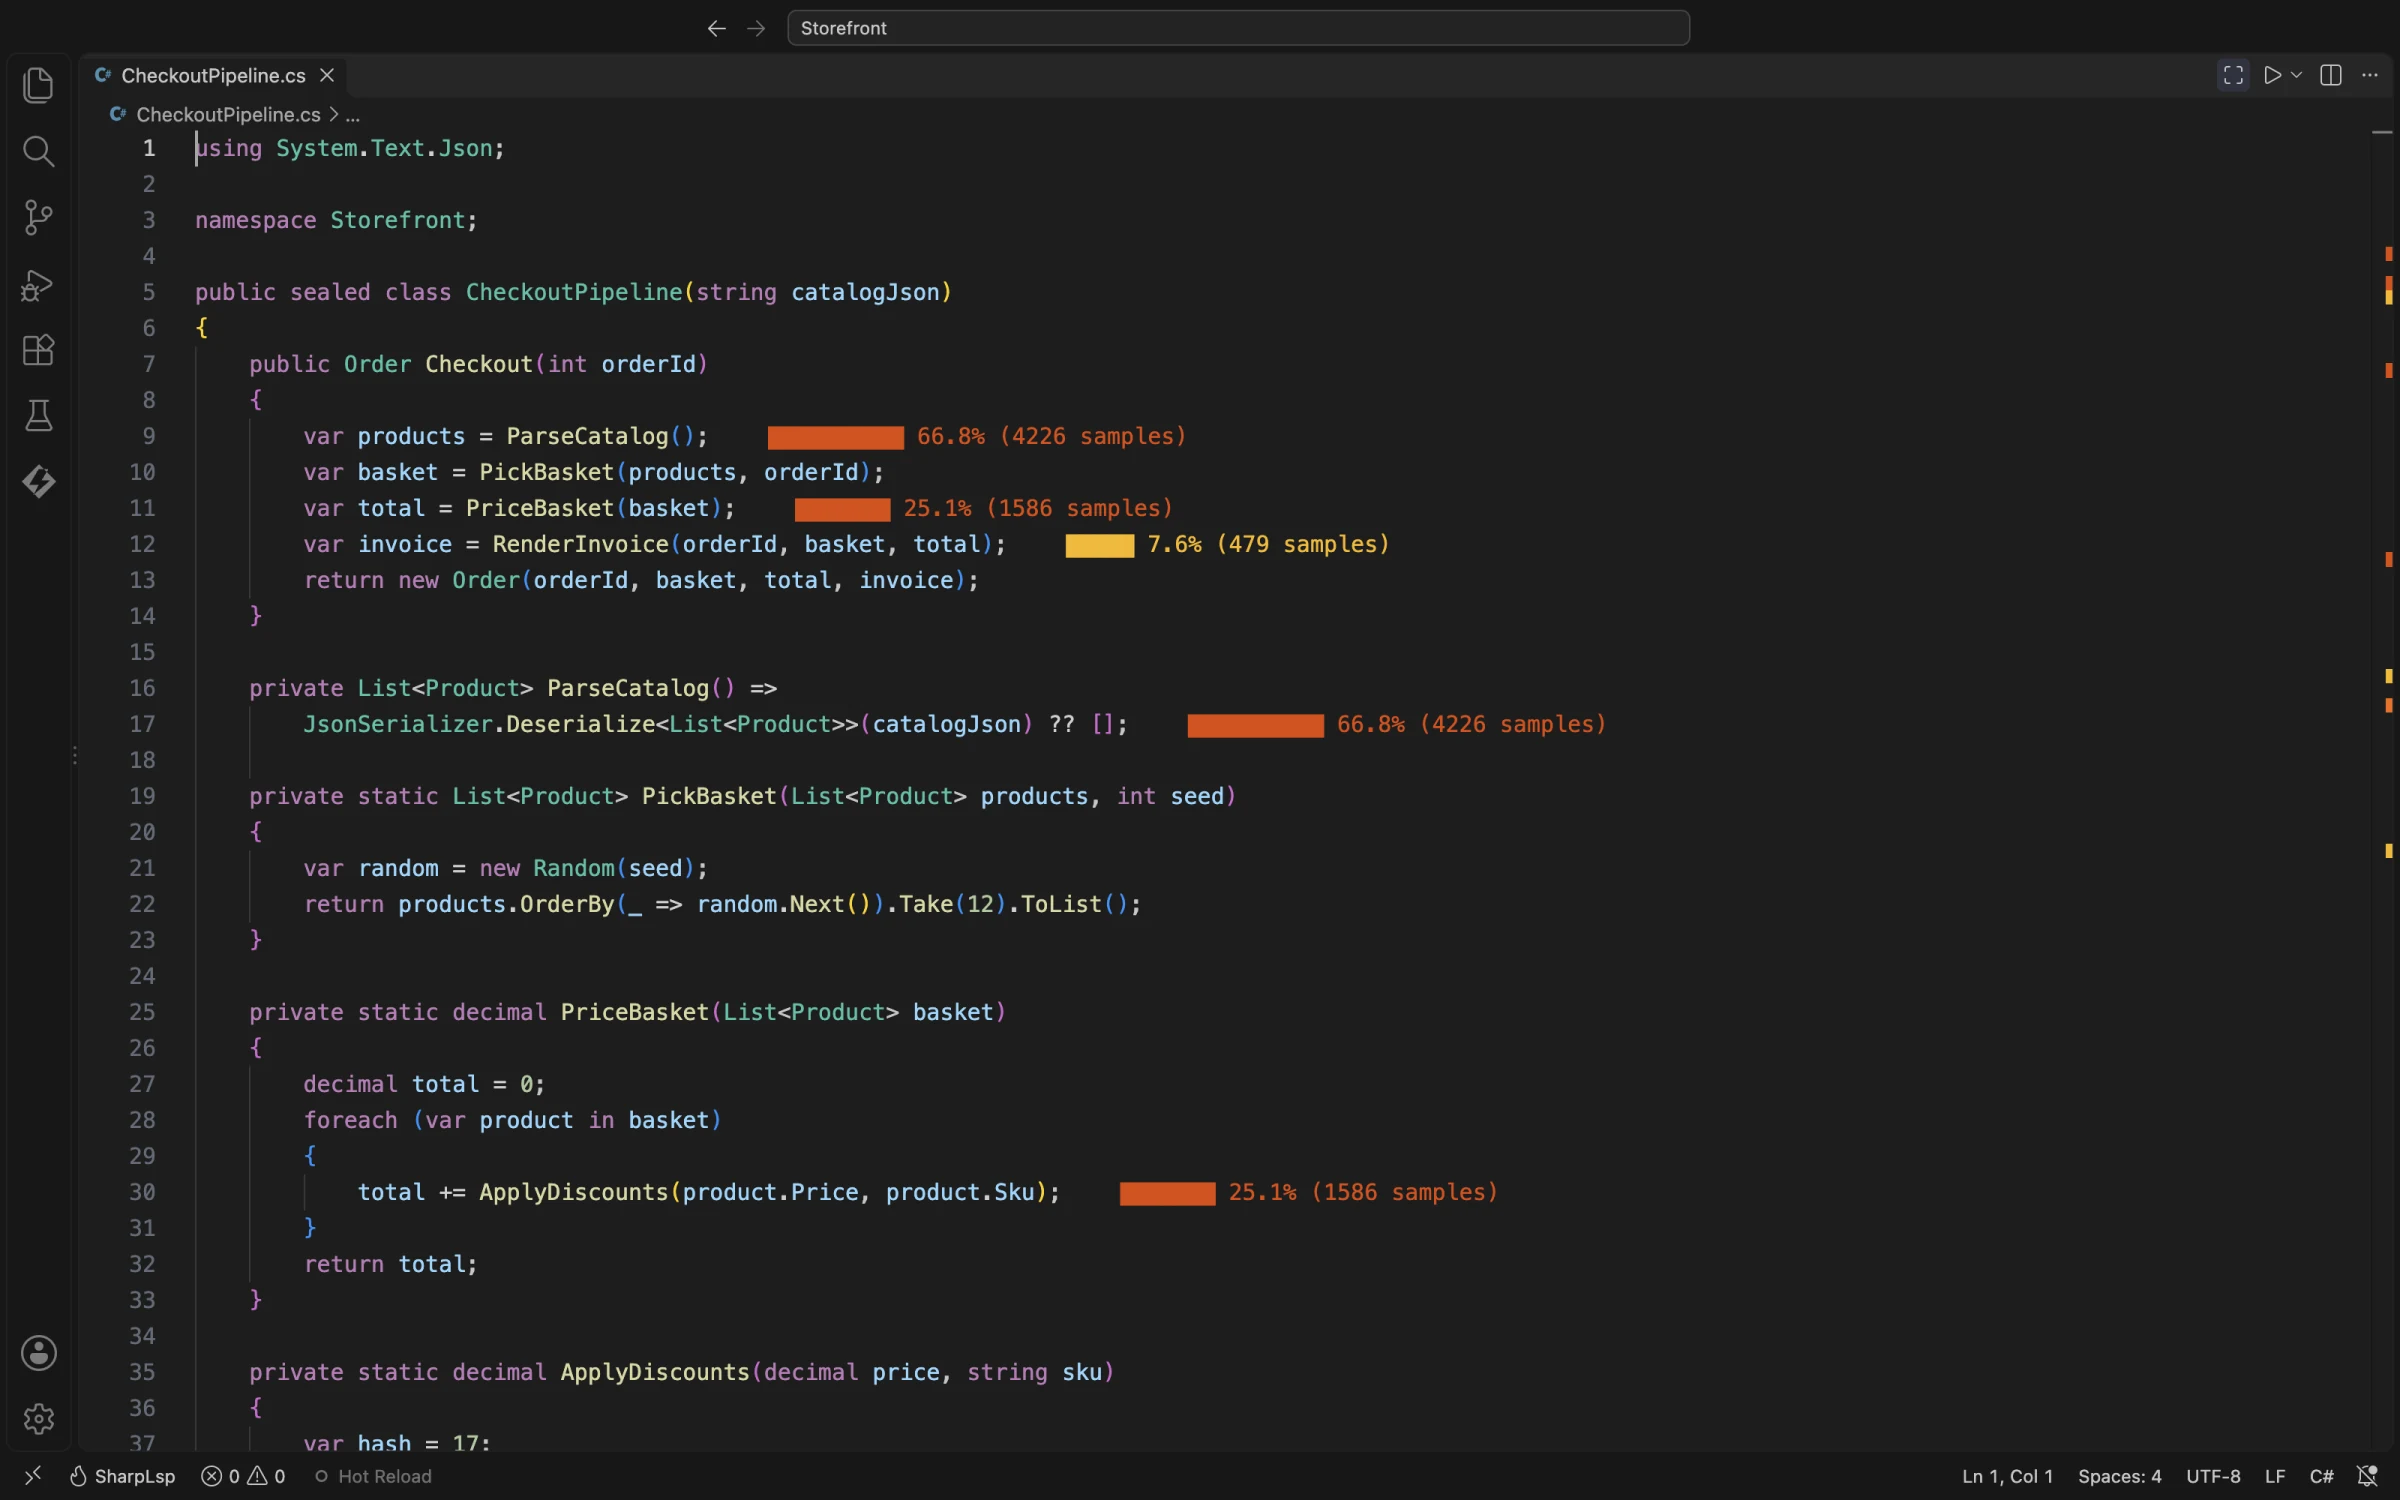
A method-level profiler would tell you Checkout is slow. The heat bars tell you it is the JsonSerializer.Deserialize call on line 17, and that pricing the basket is the next thing to look at.
The results panel opens beside the code. It shows the sample count and duration, a flame graph, and a hot-function table with total and self percentages. In a flame graph, each box is a function and its width is its share of the time. The widest box at the bottom of a tall stack is usually where to look. Click a frame to zoom into it:

ParseCatalog: the System.Text.Json deserializer is the cost.Ctrl+Alt+P (Cmd+Alt+P on macOS) starts a session from anywhere, and Take Profile Snapshot shows results so far without stopping.
Memory profiling and leak detection
Most .NET memory leaks are not leaks in the C sense. The garbage collector frees anything that nothing references. A managed leak is an object that something still holds on to:
- a static cache that never evicts;
- an event handler that is never removed;
- a singleton that captured a scoped service, which Microsoft calls a captive dependency;
- a timer or a
CancellationToken.Registercallback whose closure keeps its owner alive.
Dispose doesn't fix these on its own. Dispose releases unmanaged resources, but an object that is still referenced stays on the heap, disposed or not. To find a leak, you watch what grows and ask what keeps it alive.
That is what Track Memory does. The memory dashboard opens beside your code and snapshots the heap while the app runs:
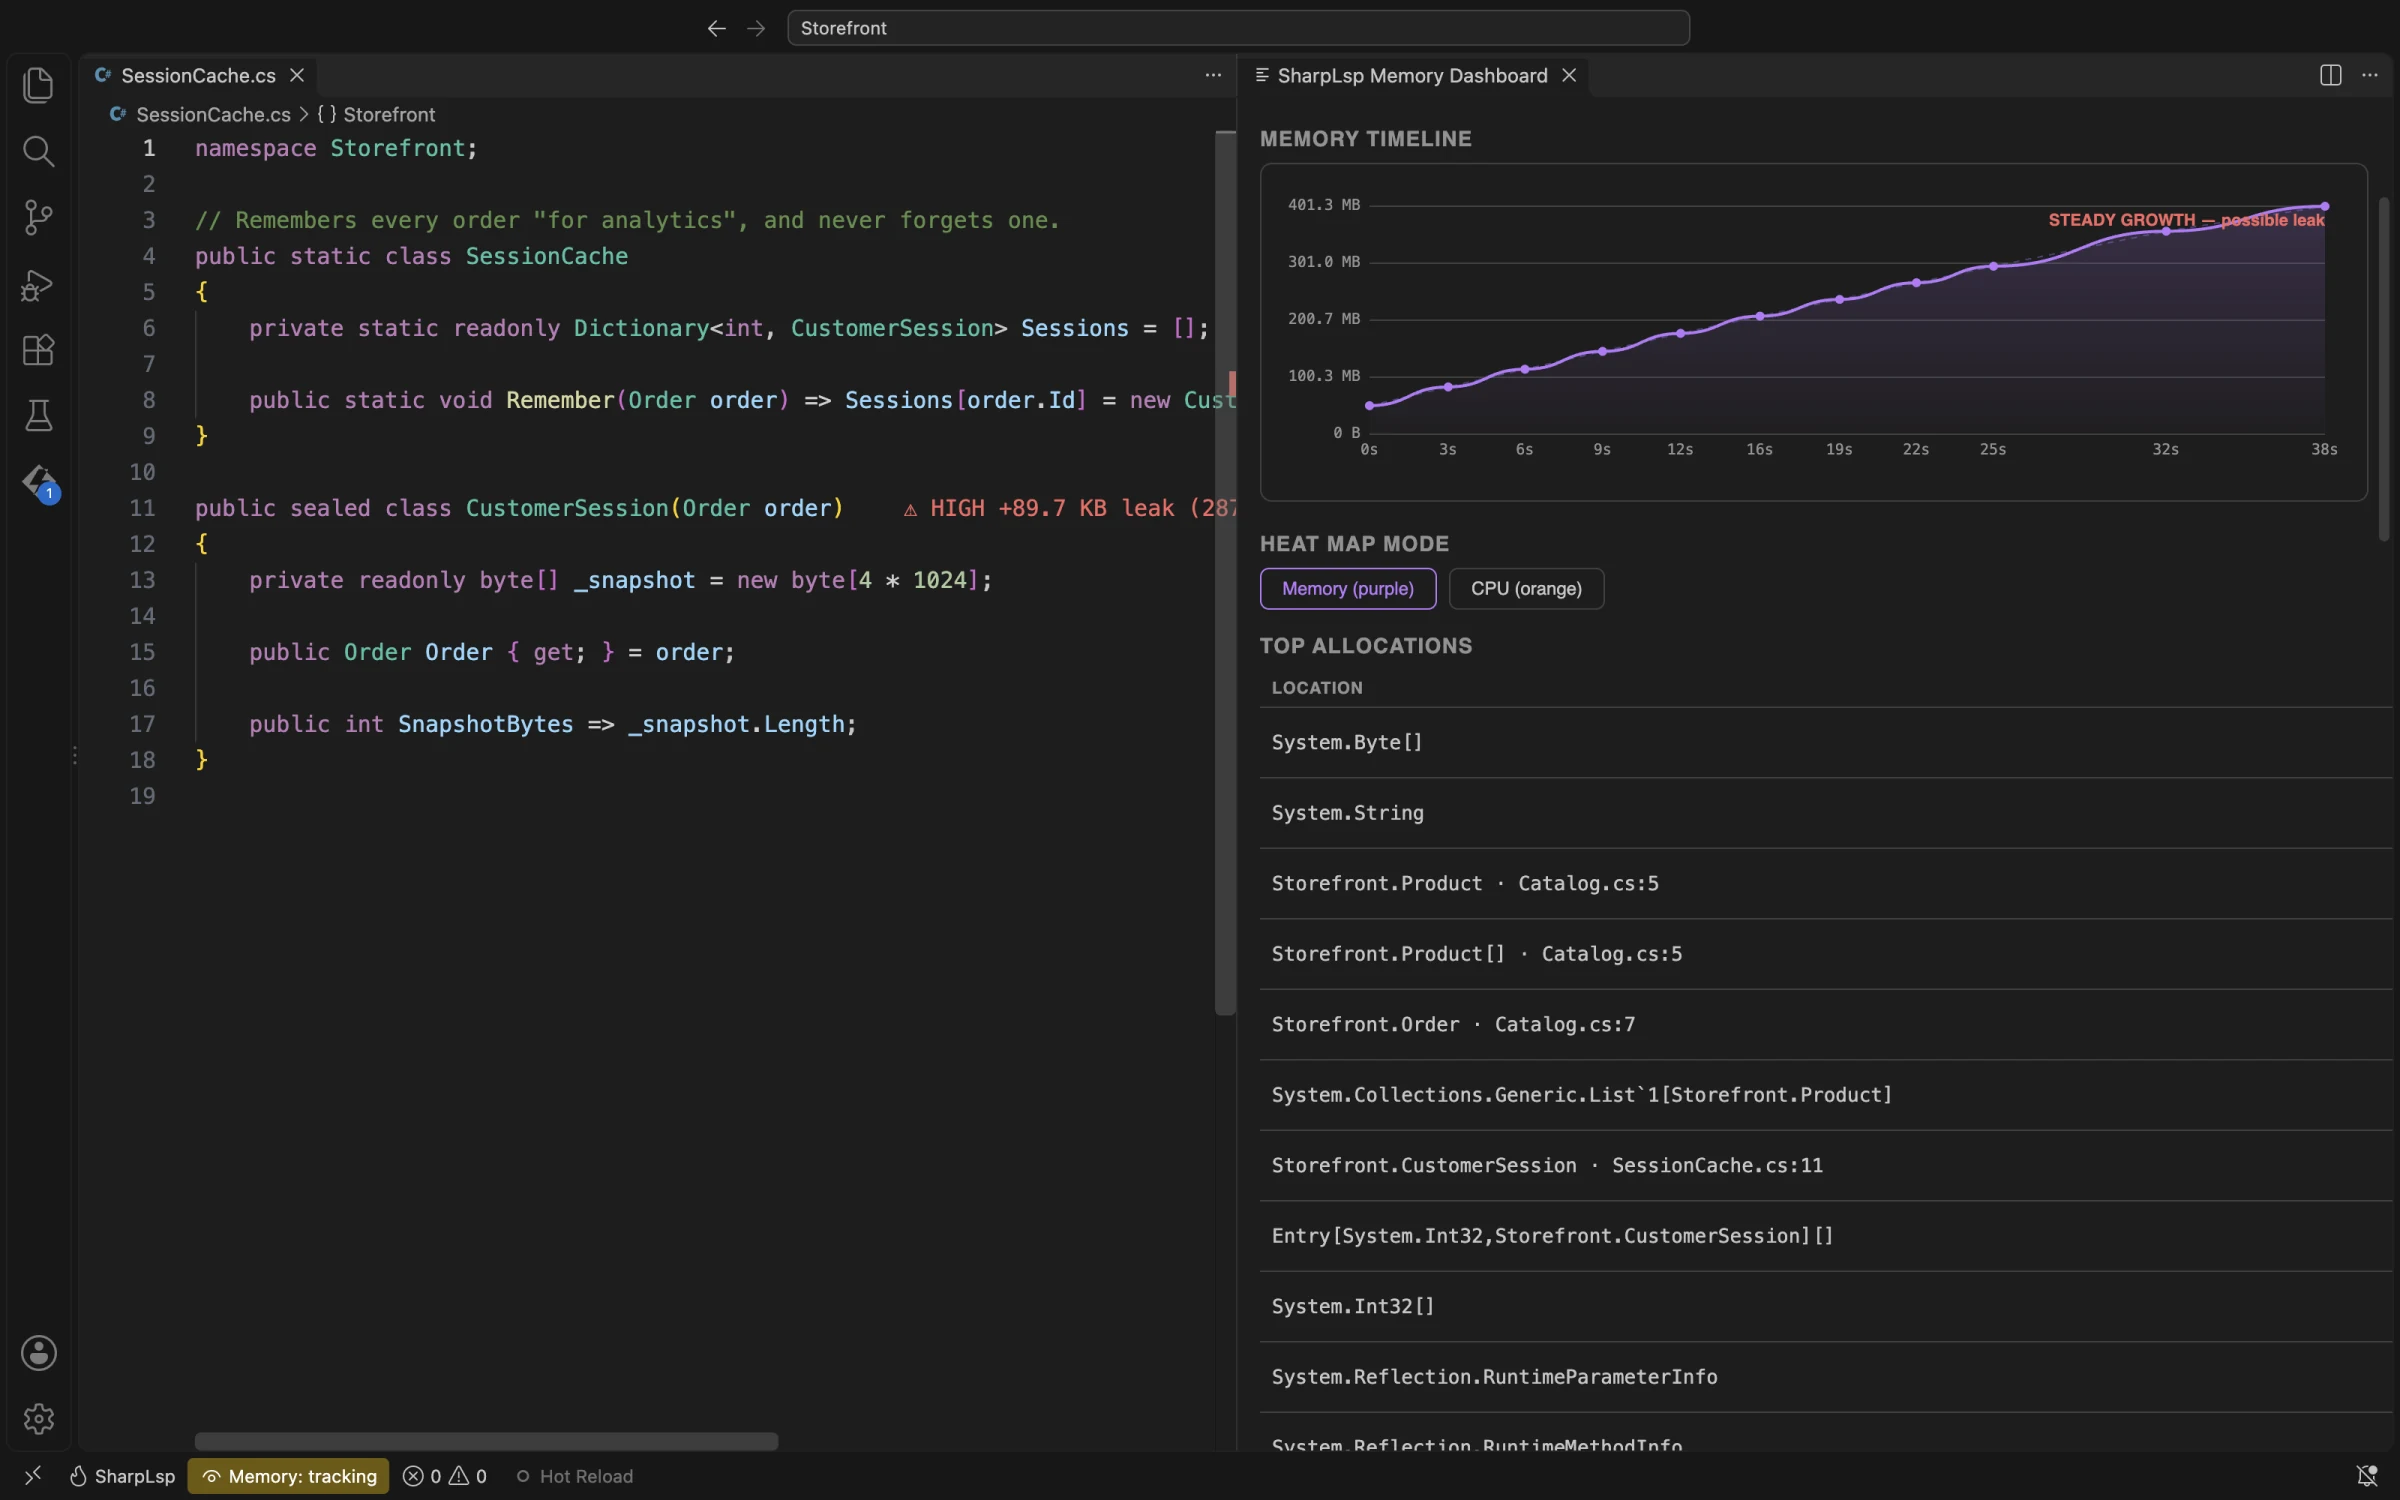
The dashboard shows current and peak memory, the live object count, a heap timeline, the top allocation sites and ranked leak suspects. You don't have to remember to take snapshots. The profiler takes one and compares it with the last every time the debugger pauses, and it can also take them on a timer.
Suspects are ranked by how consistently they grow across snapshots, with their growth in bytes and objects. In the editor, the leaking type's declaration is flagged on its own line. Sped up three times:
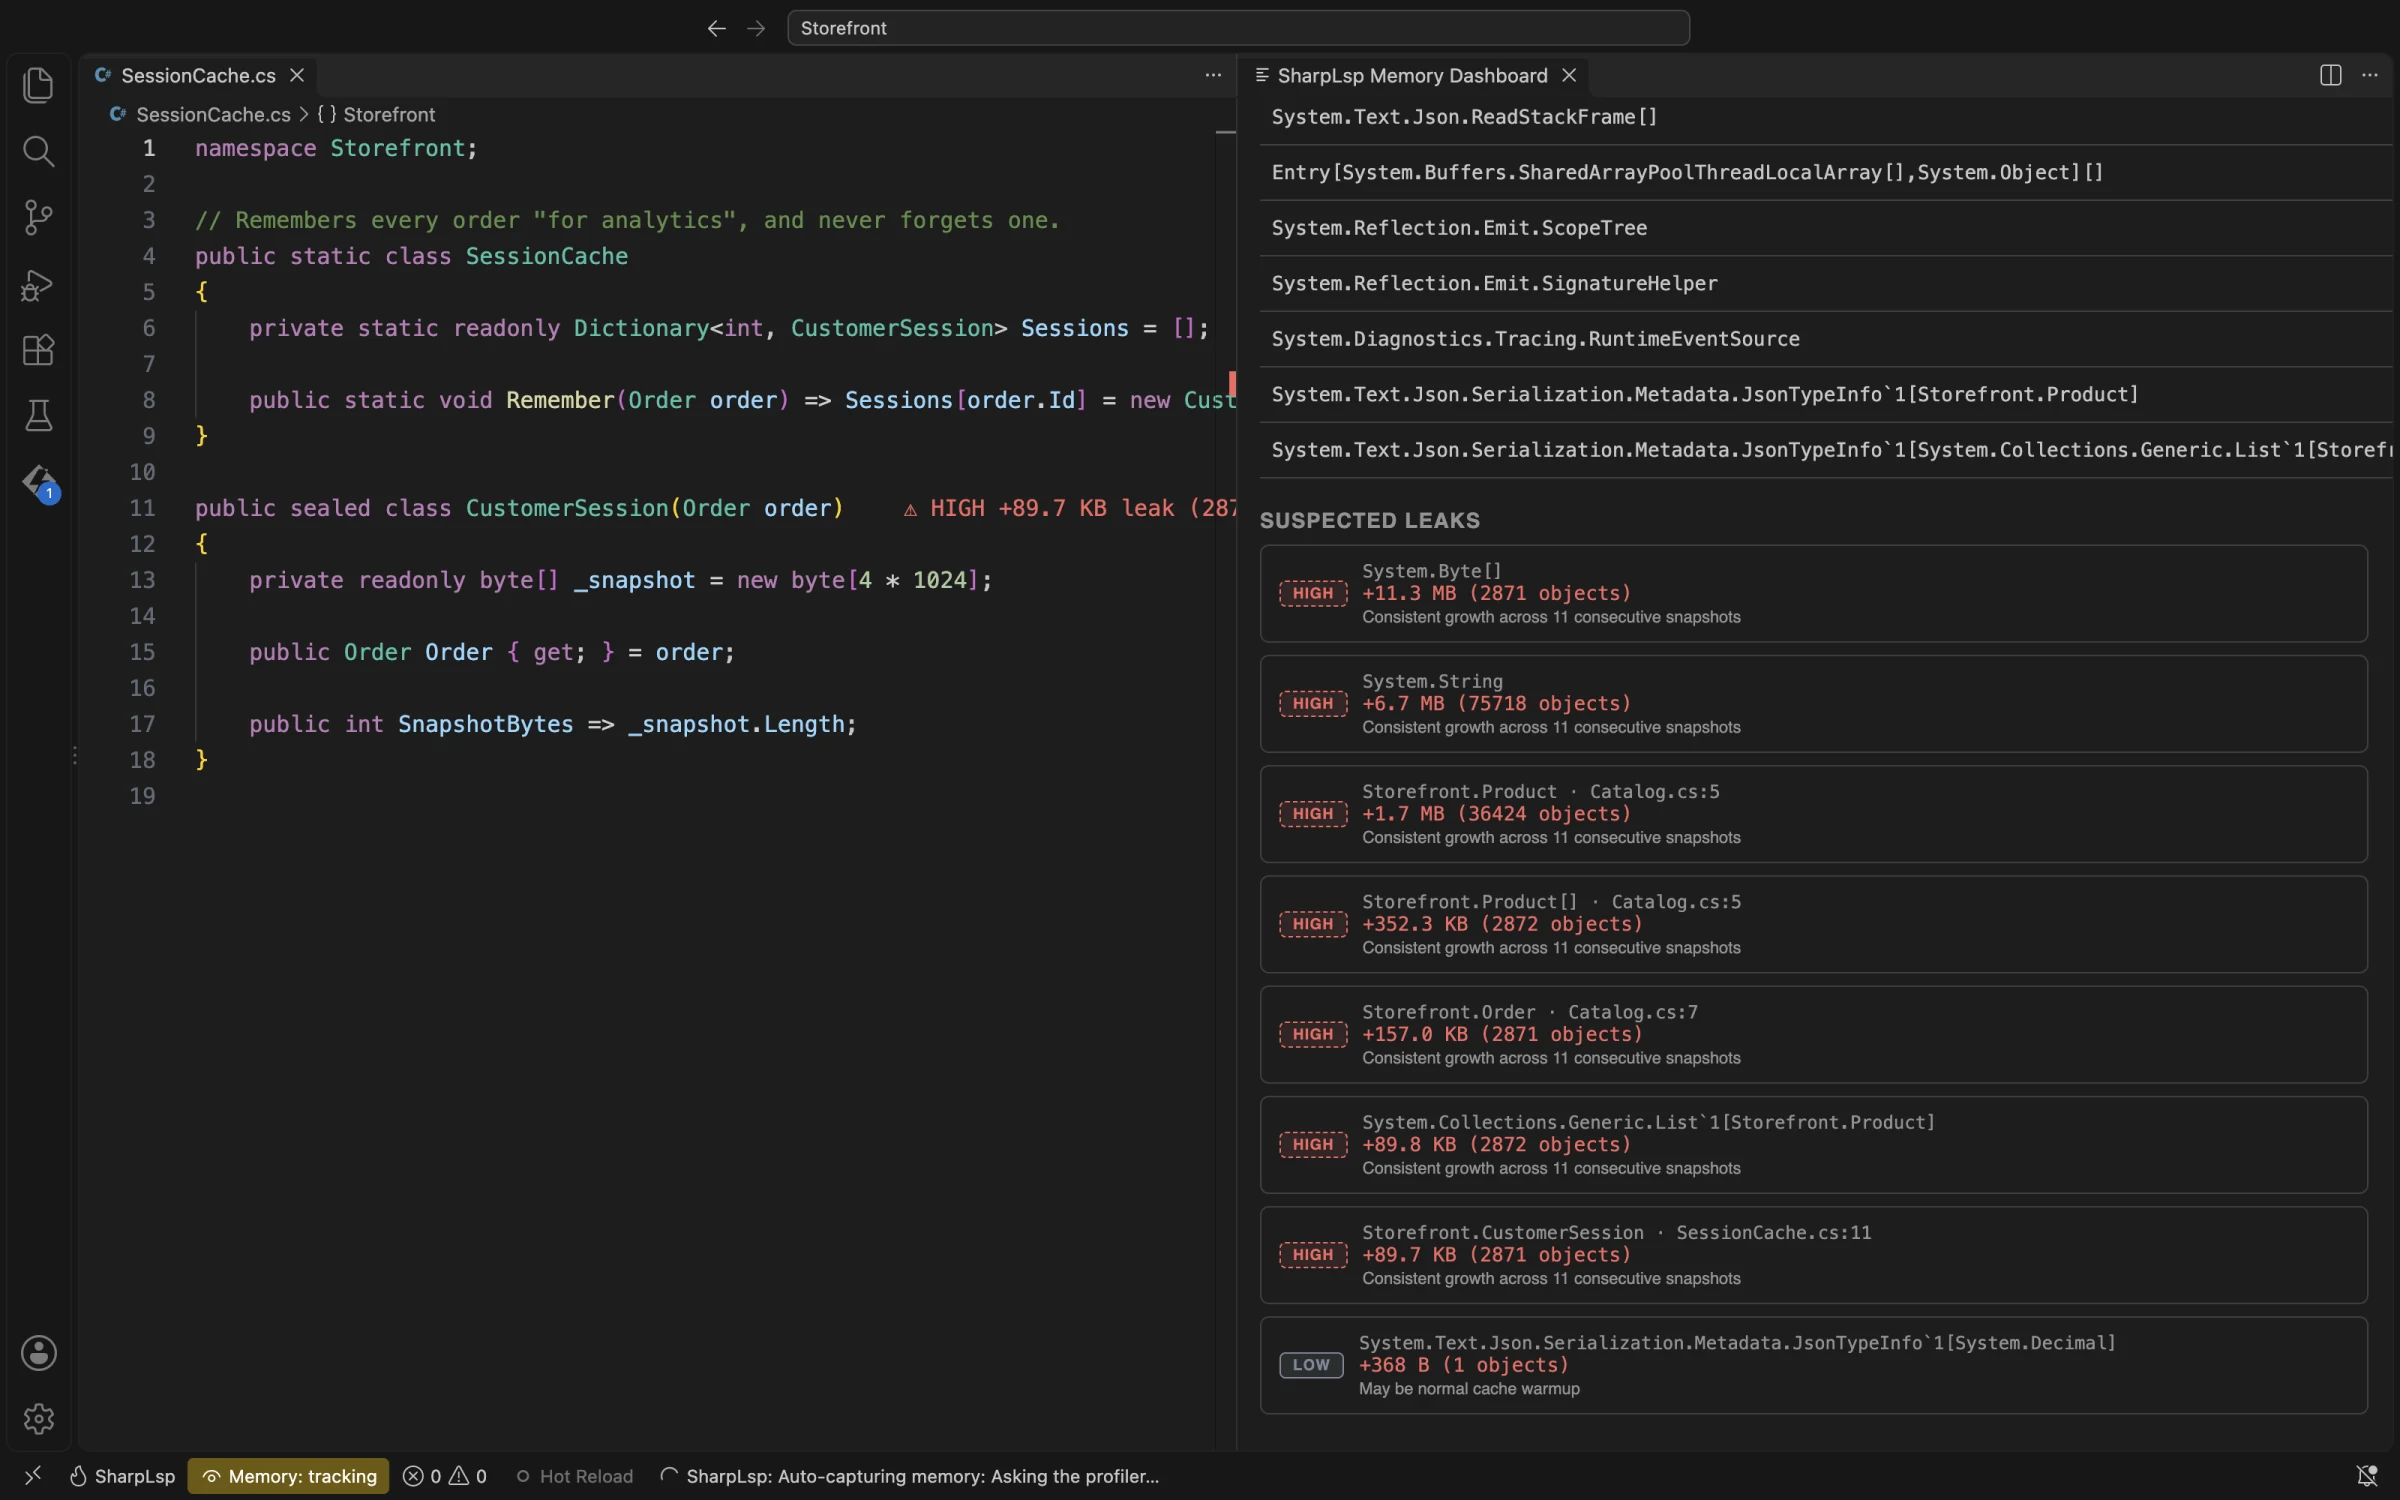
Dictionary that never evicts shows up as consistent growth in byte arrays, strings and the sessions that hold them.Show Reference Graph then draws what keeps the suspect alive, all the way back to its root. Growth is a strong hint, not proof, so the retention path is what confirms a leak. The Fix a Memory Leak guide walks through the whole loop step by step, from the first suspicion to a verified fix.
The Visual Studio profiler workflow, outside Visual Studio
If you have used the Visual Studio profiler, or dotTrace and dotMemory in Rider, the workflow will feel familiar. Those are good tools, but each one ties profiling to an IDE. Visual Studio runs only on Windows, and Microsoft retired Visual Studio for Mac in 2024. dotTrace and dotMemory are commercial products.
Many .NET developers now write their code in VS Code or one of its forks. The SharpLsp profiler runs in VS Code, Cursor, Windsurf and VSCodium on Windows, macOS and Linux. The engine needs no debugger entitlement, so memory tracking works on macOS too.
Where it fits with dotnet-trace, PerfView and BenchmarkDotNet
The .NET diagnostics tools are excellent, and SharpLsp builds on the same foundations. Its engine reads the same EventPipe channel as dotnet-trace. The difference is where the answer lands.
| Tool | What it gives you | Where you read it |
|---|---|---|
| dotnet-counters | Live runtime counters | A terminal |
| dotnet-trace | A .nettrace file of CPU samples and events |
PerfView, Visual Studio or speedscope |
| dotnet-gcdump | A heap snapshot | PerfView or Visual Studio |
| PerfView | Deep analysis of traces and heaps | Its own Windows app |
| BenchmarkDotNet | Precise timings for one method in isolation | A report |
| SharpLsp profiler | CPU samples, heap snapshots and ranked leak suspects | Your code, in the editor |
A trace file is still useful when you want to share a result or keep it. Every SharpLsp CPU session writes a speedscope JSON, a .cpuprofile that VS Code's built-in viewer opens, and the flame graph SVG under .sharplsp/profiles.
BenchmarkDotNet and the profiler answer different questions, so use both. The profiler tells you which method is slow in the real app. BenchmarkDotNet tells you whether your change made that method faster.
C# and F#, one engine
The engine attaches to the .NET runtime, not to a language, so F# gets the same profiler as C#. An F# project gets the same heat bars, flame graph, memory dashboard and leak suspects. SharpLsp treats F# as a first-class language everywhere, and the profiler is no exception.
Try it
- Install SharpLsp from the VS Code Marketplace, or from Open VSX in Cursor, Windsurf and VSCodium.
- Start your app, open the SharpLsp view and find it under Processes.
- Click Profile CPU if it is slow, or Track Memory if its memory keeps climbing.
The engine needs a .NET 8 or later runtime. A process started with DOTNET_EnableDiagnostics=0 can't be attached. The profiler docs cover every command and setting.