How to Fix a Memory Leak in C# and .NET
This guide takes a real C# memory leak from first suspicion to a measured fix. You confirm the memory keeps climbing, track the process with the free SharpLsp memory profiler in VS Code, read the leak suspects, find the reference that keeps the objects alive, fix it, and prove the fix with a test. It works on any C# or F# app running on .NET 8 or later, with no restart, no memory dump and no license. Where a step has a command-line or Visual Studio equivalent, the guide shows that too.
Here is the whole loop on SharpLsp's Storefront demo, recorded in VS Code. Fast-forwarded stretches are marked on screen:
What is a memory leak in C# and .NET?
.NET has garbage collection: the runtime frees every object that nothing references any more. So a C# memory leak is not memory you forgot to free. It is an object your app no longer needs that something still references: a static collection, an event, a long-lived service or a timer. As Microsoft's memory leak tutorial puts it, that reference "prevents the garbage collector from reclaiming the memory used". Under steady load, the process's memory climbs for as long as the leaking code runs.
Storefront has exactly this bug. Its SessionCache remembers every order "for analytics", in a static Dictionary that never removes anything:
public static class SessionCache
{
    private static readonly Dictionary<int, CustomerSession> Sessions = [];

    public static void Remember(Order order) => Sessions[order.Id] = new CustomerSession(order);
}
Each CustomerSession carries a 4 KB buffer, and nothing ever lets go of one.
Signs of a memory leak
- Memory climbs under steady load and never comes back down.
- The app gets slower over hours or days, and a restart fixes it for a while.
- Garbage collections come more often and reclaim less each time.
- The app throws
OutOfMemoryException, or its container is killed for going over its memory limit.
A memory leak or just high memory usage?
Not every climb is a leak. Server garbage collection keeps bigger heaps than workstation garbage collection by design. A cache that is meant to hold everything fills up, then levels off. And the garbage collector doesn't hand freed memory back to the operating system straight away.
To tell them apart, run SharpLsp: Force Garbage Collection, a full blocking collection. If memory drops back, it was garbage that hadn't been collected yet. If it stays up and keeps climbing under the same load, something is holding it.
Managed or native?
The Processes view shows each process's resident memory: everything the operating system has given it. The memory dashboard shows the managed heap: the objects the garbage collector tracks. If resident memory climbs while the heap stays flat, the leak is in native memory, such as a native library, a Marshal.AllocHGlobal buffer that is never freed, or an unmanaged resource whose owner is never disposed. Heap snapshots can't see native memory. Visual Studio's Memory Usage tool can snapshot native heaps on Windows. The rest of this guide finds and fixes managed leaks.
Before you start
- Install SharpLsp from the VS Code Marketplace, or from Open VSX in Cursor, Windsurf and VSCodium, and open the folder that holds your project.
- Run the app on a .NET 8 or later runtime. A process started with
DOTNET_EnableDiagnostics=0can't be attached. - Put the app under steady load: repeat the request, page or job you suspect. A leak only shows while the leaking code runs.
Step 1: Confirm the memory keeps climbing
Open the SharpLsp view and find your app under Processes. Each row shows the process's live CPU and memory. Watch the memory for a minute under steady load. Memory that rises and falls is garbage collection at work. Memory that only rises is a leak candidate. Storefront's only goes up.
From a terminal, dotnet-counters shows the same climb. Run dotnet-counters monitor --refresh-interval 1 -p <pid> and watch the GC heap size, dotnet.gc.last_collection.heap.size on .NET 9 and later.
Step 2: Track memory
Hover the row and click Track Memory, or run SharpLsp: Start Memory Tracking. The SharpLsp Memory Dashboard opens beside your code. It shows current and peak memory, the live object count and a heap timeline.
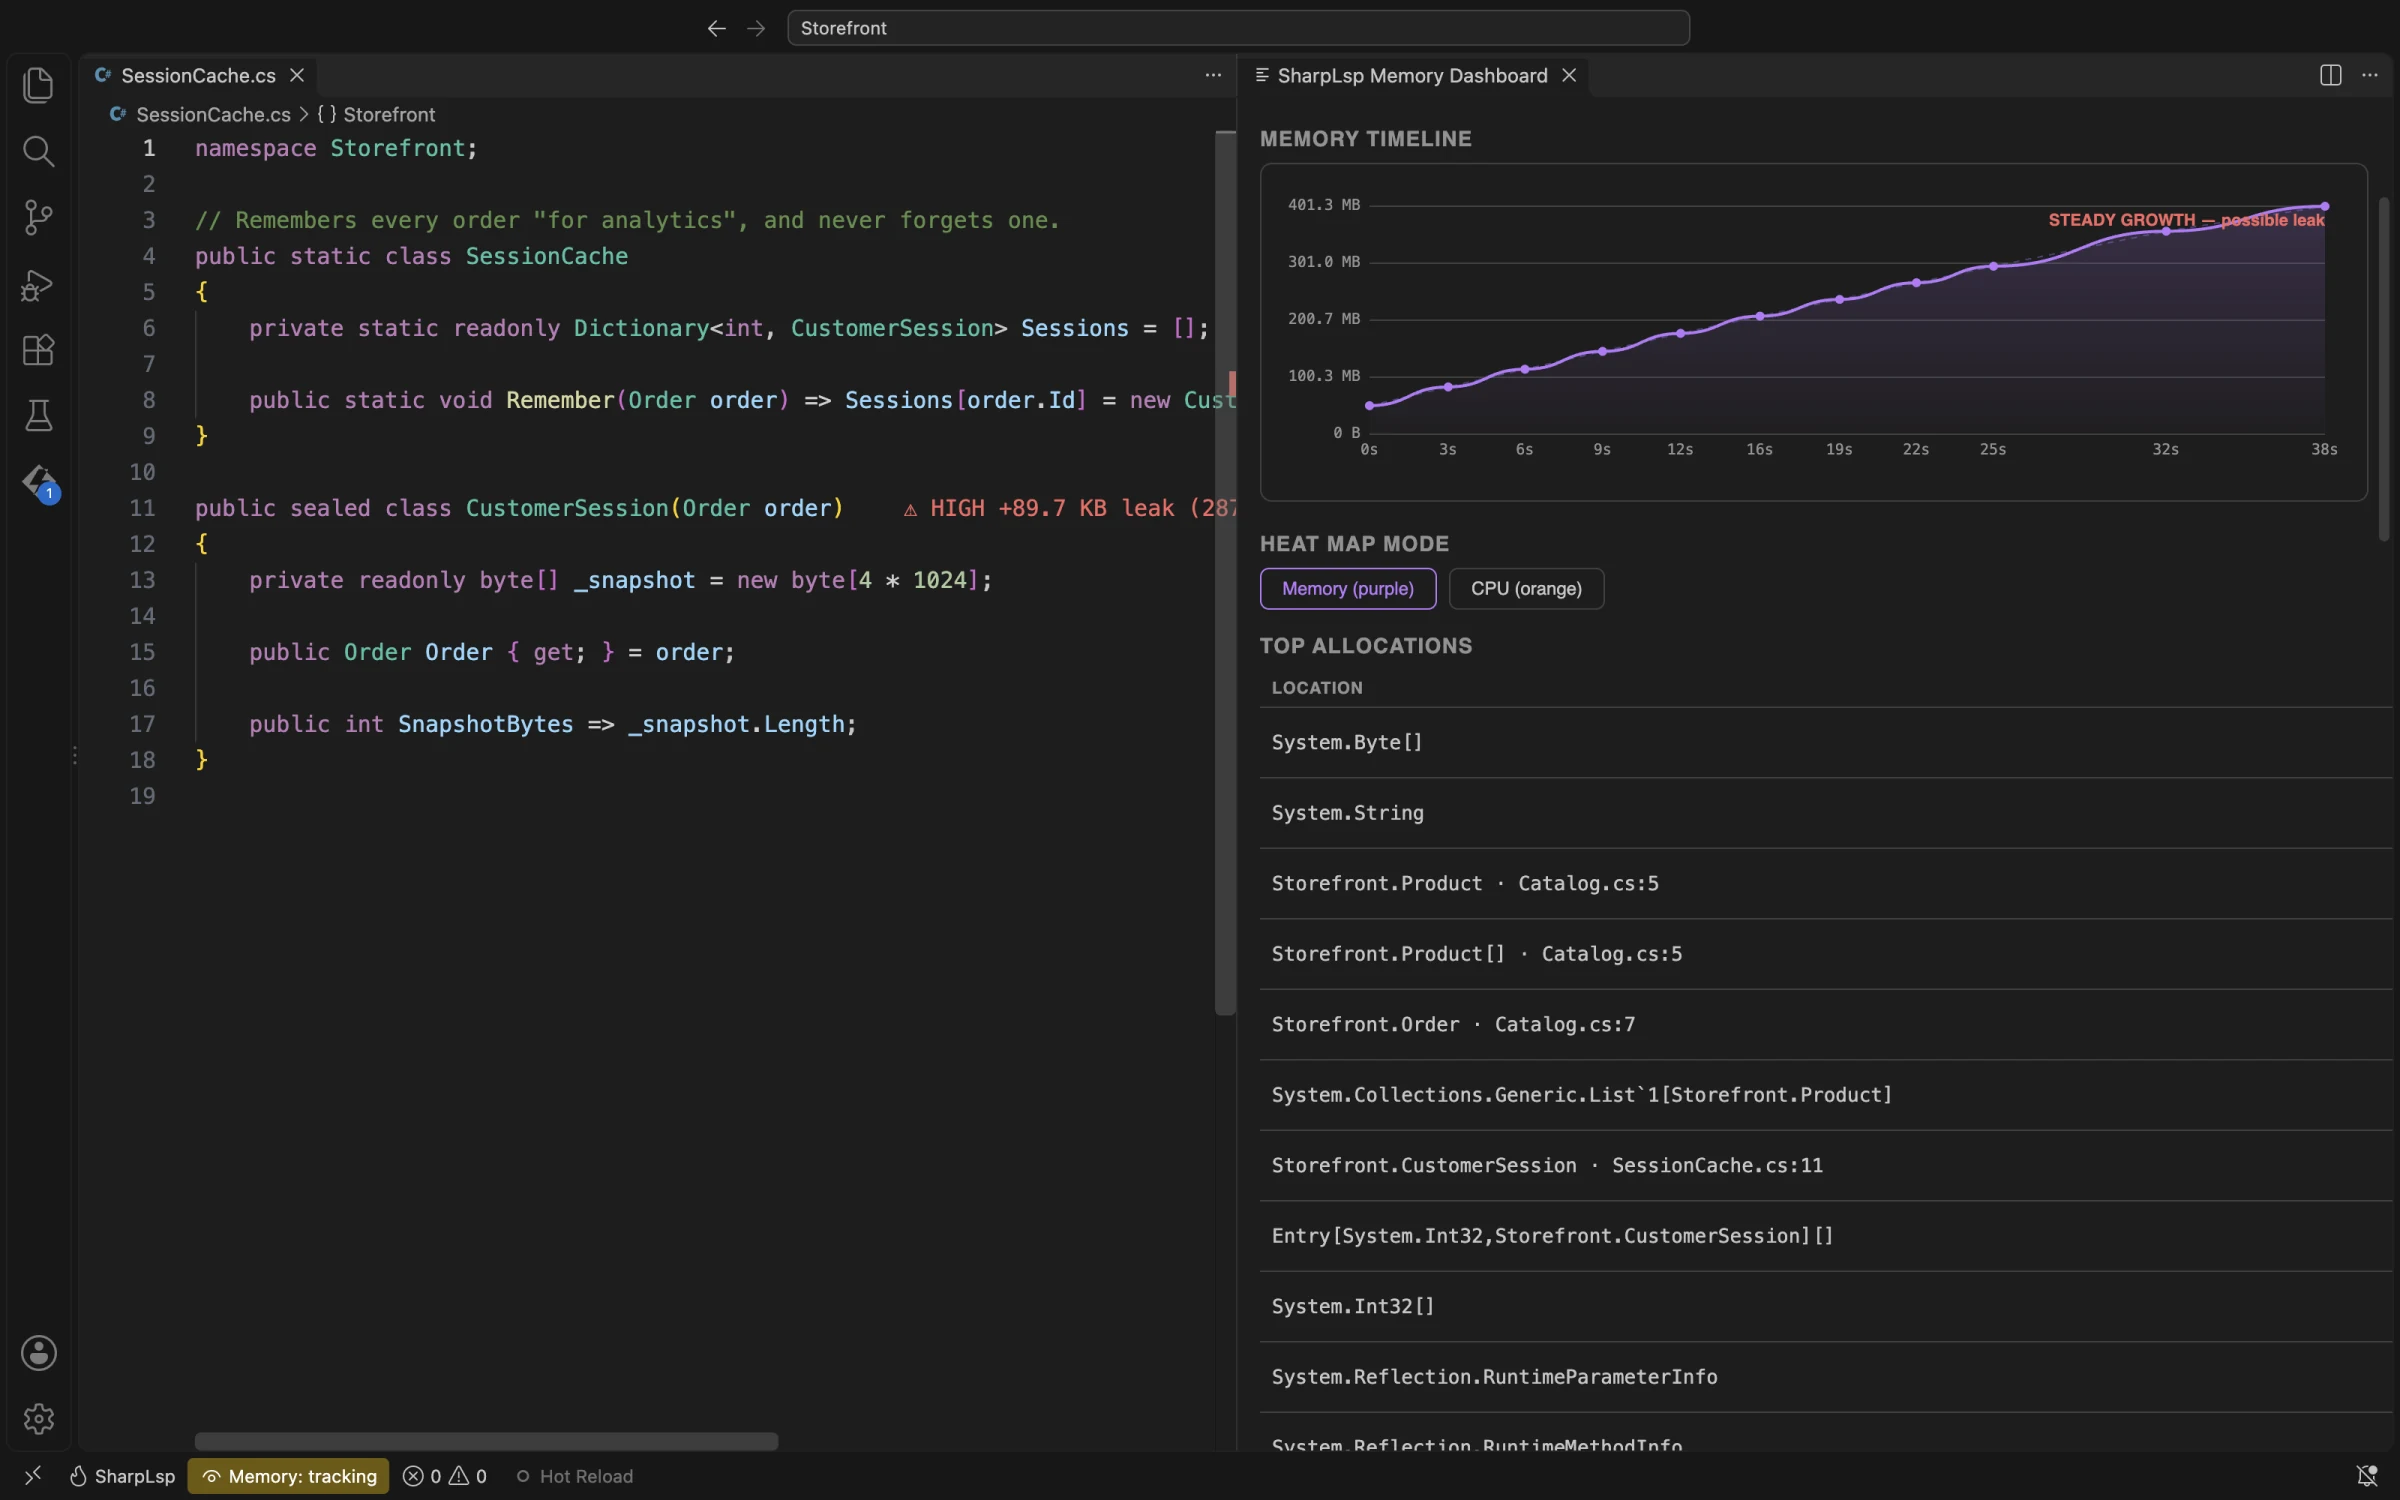
Turn on timed heap snapshots so the dashboard does the memory leak detection for you:
{
  "sharplsp.profiler.autoSnapshot": true,
  "sharplsp.profiler.autoSnapshotInterval": 10
}
You can also take snapshots yourself with SharpLsp: Take Memory Snapshot and compare them with SharpLsp: Compare Memory Snapshots. Each snapshot starts with a full garbage collection, so it counts only the objects that survive it.
Step 3: Read the leak suspects
Each snapshot is compared with the one before it. A type whose memory grows becomes a leak suspect, and its confidence rises with every consecutive growth:
| Evidence | Confidence |
|---|---|
| One growth | Low |
| Two growths in a row, or one growth over 10 MiB | Medium |
| Three growths in a row | High |
A snapshot where the type doesn't grow resets its streak, so normal churn rarely reaches High. Each suspect shows its growth in bytes and objects. Click a suspect to open its allocation site. In the editor, the leaking type's declaration gets a purple heat bar and a leak marker. When the first suspect reaches High, SharpLsp offers Show Reference Graph in a notification.
Within a few snapshots, Storefront's CustomerSession is High, along with everything it holds: its byte arrays, orders and product lists.
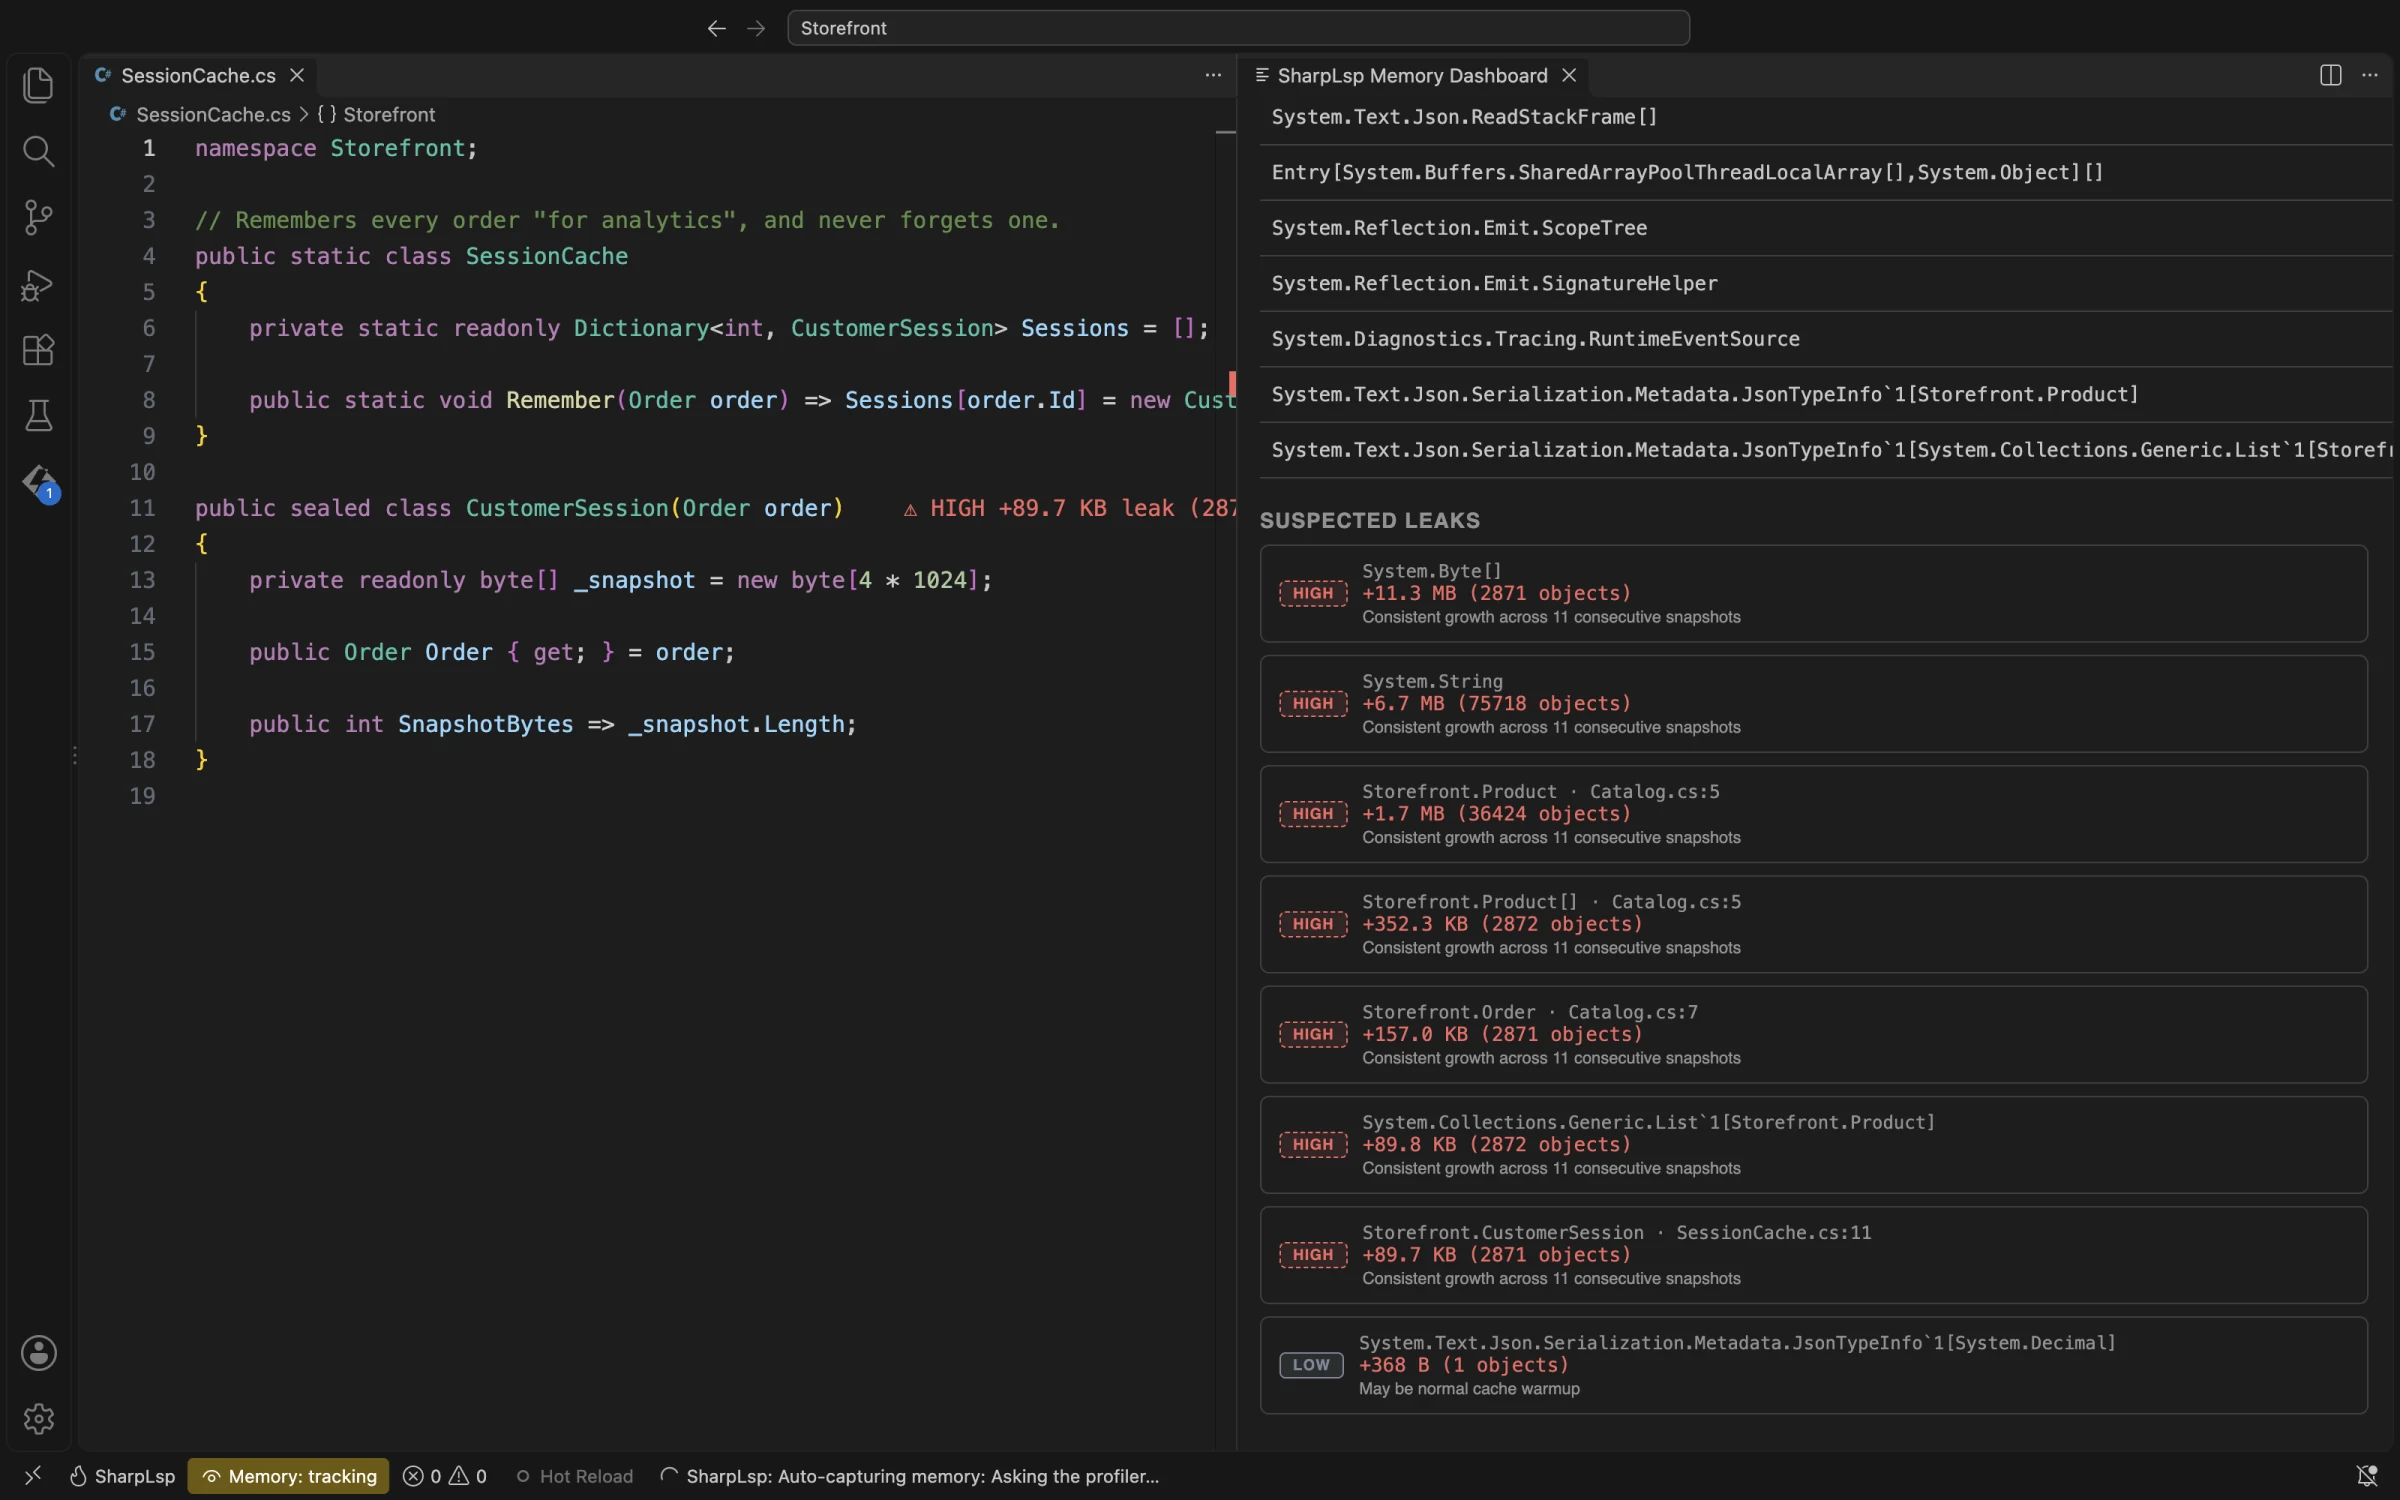
Dictionary that never evicts shows up as consistent growth in byte arrays, strings and the sessions that hold them.Step 4: Find what keeps it alive
Growth tells you what leaks. The fix needs why. Run SharpLsp: Show Reference Graph and pick the suspect's type. The list offers the types the runtime reported in the latest snapshot. Choose Other type… to enter a name exactly as the runtime spells it, such as Storefront.CustomerSession.
The retention graph draws the objects that hold the type and the roots that keep them alive. Read it from the root down, then find the field in your code that holds the root. In Storefront, every CustomerSession hangs off the entry array of one Dictionary<int, CustomerSession>, and the only field of that type is the static SessionCache.Sessions. That is the reference to cut.
This is the question gcroot answers in a memory dump, and Paths to Root answers in Visual Studio. Heap growth is a signal, not proof. Confirm a suspect with its retention path and with what the code is meant to do: a cache that is supposed to hold everything is not a leak.
Step 5: Fix the memory leak
Storefront's cache only needs recent orders, so keep a window of the last 1,000 and evict the rest:
// Remembers the last 1,000 orders "for analytics", and forgets older ones.
public static class SessionCache
{
    private static readonly Dictionary<int, CustomerSession> Sessions = [];

    public static void Remember(Order order)
    {
        Sessions[order.Id] = new CustomerSession(order);
        Sessions.Remove(order.Id - 1_000);
    }
}
The same leak in F# is a module-level Dictionary, and the fix is the same:
let private sessions = Dictionary<int, CustomerSession>()

let remember (order: Order) =
    sessions[order.Id] <- CustomerSession order
    sessions.Remove(order.Id - 1_000) |> ignore
In real code, MemoryCache with a size limit or an expiration does the same job. If your retention path ends somewhere else, find its fix under Common C# memory leaks below.
Step 6: Prove the fix
Rebuild, run the app under the same load and track memory again. The heap timeline should level off once the cache fills, and no suspect should climb to High. If one still does, show its reference graph again: a second root is holding it.
In the recording, the leaking build passed 160 MB before its suspects reached High. The fixed build holds at about 8 MB, its timeline is flat, and no suspect climbs past Low. A fix you haven't measured is a guess. This one is measured. To keep it fixed, add a leak test, as shown below.
Common C# memory leaks and how to fix them
The steps don't change from one leak to the next. Only the root at the end of the retention path does:
| The path ends at | Fix |
|---|---|
| A static collection or cache | Bound it: evict old entries, cap the size, or use MemoryCache with an expiration |
| An event on a long-lived object | Unsubscribe with -= when the subscriber is done, for example in its Dispose |
| A singleton service | Check dependency injection lifetimes: a singleton that captures a scoped service keeps it for the app's lifetime |
| A timer | Dispose the timer when its owner goes away |
| A cancellation token | Dispose the CancellationTokenRegistration when the work ends |
| A lambda stored on a long-lived object | The closure captured the object: capture less, or remove the delegate when you are done |
A static collection or cache that never evicts
Storefront's leak is this one. A static field lives as long as the app, and so does everything in it. So does a module-level value in F#. Bound the collection, or use MemoryCache with an expiration or a SizeLimit. With a SizeLimit, every entry must set its Size.
An event handler that is never removed
public sealed class PriceTicker(MarketFeed feed) : IDisposable
{
    public void Start() => feed.PriceChanged += OnPriceChanged;

    public void Dispose() => feed.PriceChanged -= OnPriceChanged;

    private void OnPriceChanged(object? sender, decimal price) { }
}
The long-lived MarketFeed holds every subscriber through its event. Without the -=, each PriceTicker lives as long as the feed. The retention path ends at the feed's event field.
In F#, Add subscribes for good. Subscribe returns an IDisposable that removes the handler, so keep it and dispose it with the subscriber:
type PriceTicker(feed: MarketFeed) =
    let mutable last = 0M
    let subscription = feed.PriceChanged.Subscribe(fun price -> last <- price)

    member _.Last = last

    interface IDisposable with
        member _.Dispose() = subscription.Dispose()
In WPF, where a control can't always tell when to unsubscribe, use the weak event patterns.
A singleton that captures a scoped service
With dependency injection, a singleton lives for the whole app. If it takes a scoped service, such as a DbContext, that one instance is captured for the app's lifetime, along with every entity it tracks:
builder.Services.AddDbContext<ShopContext>();
builder.Services.AddSingleton<PriceCache>();

// Leaks: one ShopContext, and everything it tracks, lives as long as the app.
public sealed class PriceCache(ShopContext db) { }
Microsoft's dependency injection guidelines call this a captive dependency. Turn on scope validation and the container refuses it when it resolves the singleton. ASP.NET Core turns it on in the Development environment. The fix is to take IServiceScopeFactory and create a scope per unit of work:
public sealed class PriceCache(IServiceScopeFactory scopes)
{
    public async Task<decimal> PriceOfAsync(int productId)
    {
        await using var scope = scopes.CreateAsyncScope();
        var db = scope.ServiceProvider.GetRequiredService<ShopContext>();
        return await db.Products.Where(p => p.Id == productId).Select(p => p.Price).SingleAsync();
    }
}
The same guidelines warn about disposable transient services. The container keeps each one until its scope ends, so one resolved from the root provider stays until the app stops.
A timer that outlives its owner
public sealed class StockPoller : IDisposable
{
    private readonly Timer timer;

    public StockPoller() => timer = new Timer(_ => Poll(), null, TimeSpan.Zero, TimeSpan.FromSeconds(5));

    public void Dispose() => timer.Dispose();

    private void Poll() { }
}
The poller keeps its timer in a field, as the Timer documentation requires, and the timer's callback points back at the poller. While the timer runs, the runtime's timer queue holds that callback, so the poller can never be collected. Dispose the timer with its owner.
A callback registered on a long-lived token
// Each call adds a callback to the app's stopping token, and only shutdown removes it.
lifetime.ApplicationStopping.Register(() => session.Close());

// Fixed: the registration is removed when the work ends.
using var registration = lifetime.ApplicationStopping.Register(() => session.Close());
CancellationToken.Register returns a CancellationTokenRegistration. Until you dispose it or the token is cancelled, the token's source holds the callback and everything it captures.
A closure in F#
let handlers = ResizeArray<unit -> unit>()

let watch (session: CustomerSession) =
    handlers.Add(fun () -> printfn "%d" session.SnapshotBytes)
The lambda captures session, and the module-level list keeps every lambda. The retention path ends at handlers. Remove the delegate when you are done, or capture only the value you need.
Keep a leak fixed with a test
A leak test drops every reference the code under test should drop, collects, and asserts the object is gone. Create the object in a separate method that isn't inlined, so no local variable in the test keeps it alive. GC.KeepAlive(feed) keeps the long-lived publisher alive to the end, so the test fails while the ticker is still subscribed:
[Fact]
public void ADisposedTickerCanBeCollected()
{
    var feed = new MarketFeed();
    var ticker = StartAndDispose(feed);

    GC.Collect();
    GC.WaitForPendingFinalizers();
    GC.Collect();

    Assert.False(ticker.IsAlive);
    GC.KeepAlive(feed);
}

[MethodImpl(MethodImplOptions.NoInlining)]
private static WeakReference StartAndDispose(MarketFeed feed)
{
    using var ticker = new PriceTicker(feed);
    ticker.Start();
    return new WeakReference(ticker);
}
The same test in F#:
[<MethodImpl(MethodImplOptions.NoInlining)>]
let startAndDispose (feed: MarketFeed) =
    use ticker = new PriceTicker(feed)
    WeakReference ticker

[<Fact>]
let ``a disposed ticker can be collected`` () =
    let feed = MarketFeed()
    let ticker = startAndDispose feed
    GC.Collect()
    GC.WaitForPendingFinalizers()
    GC.Collect()
    Assert.False ticker.IsAlive
    GC.KeepAlive feed
Take the unsubscribe out of Dispose and the test fails: the feed's event still holds the ticker. A WeakReference watches an object without keeping it alive.
Memory leak detection from the command line
On a server or in a container, the .NET diagnostics tools find the same leak without an editor. Microsoft's Debug a memory leak tutorial walks through them.
Confirm the climb with dotnet-counters:
dotnet tool install --global dotnet-counters
dotnet-counters ps
dotnet-counters monitor --refresh-interval 1 -p
Snapshot the heap with dotnet-gcdump. report lists the heap's types by size. Collect two GC dumps a few minutes apart and compare them in Visual Studio or PerfView on Windows. Collecting one triggers a full garbage collection, which can pause an app with a large heap for a long time.
dotnet-gcdump collect -p
dotnet-gcdump report .gcdump
Find the root with dotnet-dump and its SOS commands. dumpheap -stat lists types by count and size, dumpheap -mt lists one type's instances, and gcroot prints the chain of references from a root to one instance. A dump holds the process's whole memory, including any secrets in it, so handle it like production data.
dotnet-dump collect -p
dotnet-dump analyze
> dumpheap -stat
> dumpheap -mt
> gcroot
In production, dotnet-monitor collects the same dumps and GC dumps through an HTTP API.
| Tool | Where it runs | Use it to |
|---|---|---|
| SharpLsp memory profiler | VS Code, Cursor, Windsurf and VSCodium on Windows, macOS and Linux | Rank leak suspects live and draw the retention path beside your code |
dotnet-counters |
Any terminal | Confirm the heap keeps climbing |
dotnet-gcdump |
Any terminal; open the files on Windows | Snapshot a live heap and compare snapshots |
dotnet-dump |
Any terminal | Keep a full dump and find roots with gcroot |
dotnet-monitor |
Servers and containers | Collect dumps in production |
| Visual Studio Memory Usage | Windows | Snapshot, compare and follow Paths to Root while debugging |
| PerfView | Windows | Analyze heaps and garbage collection in depth |
Questions
Does Dispose fix a memory leak?
Not on its own. Dispose and the using statement release unmanaged resources, such as handles, sockets and native memory, at a known time. They don't make an object collectable while something still references it. A disposed object held by a static list is still a leak. Dispose fixes a leak when it is where you unsubscribe events, stop timers or clear caches, as in PriceTicker above. Microsoft's Implement a Dispose method covers the pattern.
Does GC.Collect fix a memory leak?
No. A collection frees only objects that nothing references, and a leaked object is referenced. Forcing one is useful when you diagnose and test, to rule out garbage that hasn't been collected yet. It never fixes a leak.
Do I need a heap dump or a memory dump?
No. dotnet-dump and dotnet-gcdump write a file that you then open in another tool, such as Visual Studio or PerfView. SharpLsp reads heap snapshots from the running process through the runtime's diagnostics channel, so the memory profiler works in the editor on Windows, macOS and Linux. Use a dump when you need to keep the evidence, or when the process runs on a machine you can't attach to.
Is this the Visual Studio memory profiler?
No. It is SharpLsp's own memory profiler, open source and MIT-licensed. Visual Studio's Memory Usage tool covers the same loop on Windows: snapshots, comparisons and Paths to Root, plus an insight for event handler leaks. SharpLsp brings that loop to VS Code, Cursor, Windsurf and VSCodium on every platform.
Further reading
- Debug a memory leak: Microsoft's tutorial for
dotnet-countersanddotnet-dump - Fundamentals of garbage collection: how the .NET garbage collector decides what is still alive
- mem-doc: the .NET memory analysis guide by Maoni Stephens, the .NET GC architect, who also writes about the GC on the .NET Blog
- Pro .NET Memory Management: the book on .NET memory internals, by Konrad Kokosa, Kevin Gosse and Christophe Nasarre
- Dependency injection guidelines: captive dependencies and disposable transient services
- Measure memory usage in your apps: Visual Studio's Memory Usage tool
- 8 Ways You can Cause Memory Leaks in .NET: Michael Shpilt's catalogue of common causes
Related
- Profiler: every profiler command and setting
- Configuration: the
[profiler]table insharplsp.toml