Profiler workflows exposed by the alpha VS Code extension.
Profiler
SharpLsp integrates .NET diagnostics workflows into VS Code. The extension exposes commands for process discovery, traces, counters, dumps, heap analysis, and related file actions while the profiler experience is being hardened for beta.
Prerequisites
Install the .NET diagnostic tools globally:
dotnet tool install -g dotnet-trace
dotnet tool install -g dotnet-counters
dotnet tool install -g dotnet-dump
SharpLsp auto-discovers these tools on PATH and via dotnet tool list -g. If a tool is missing, commands return an actionable error with the install command.
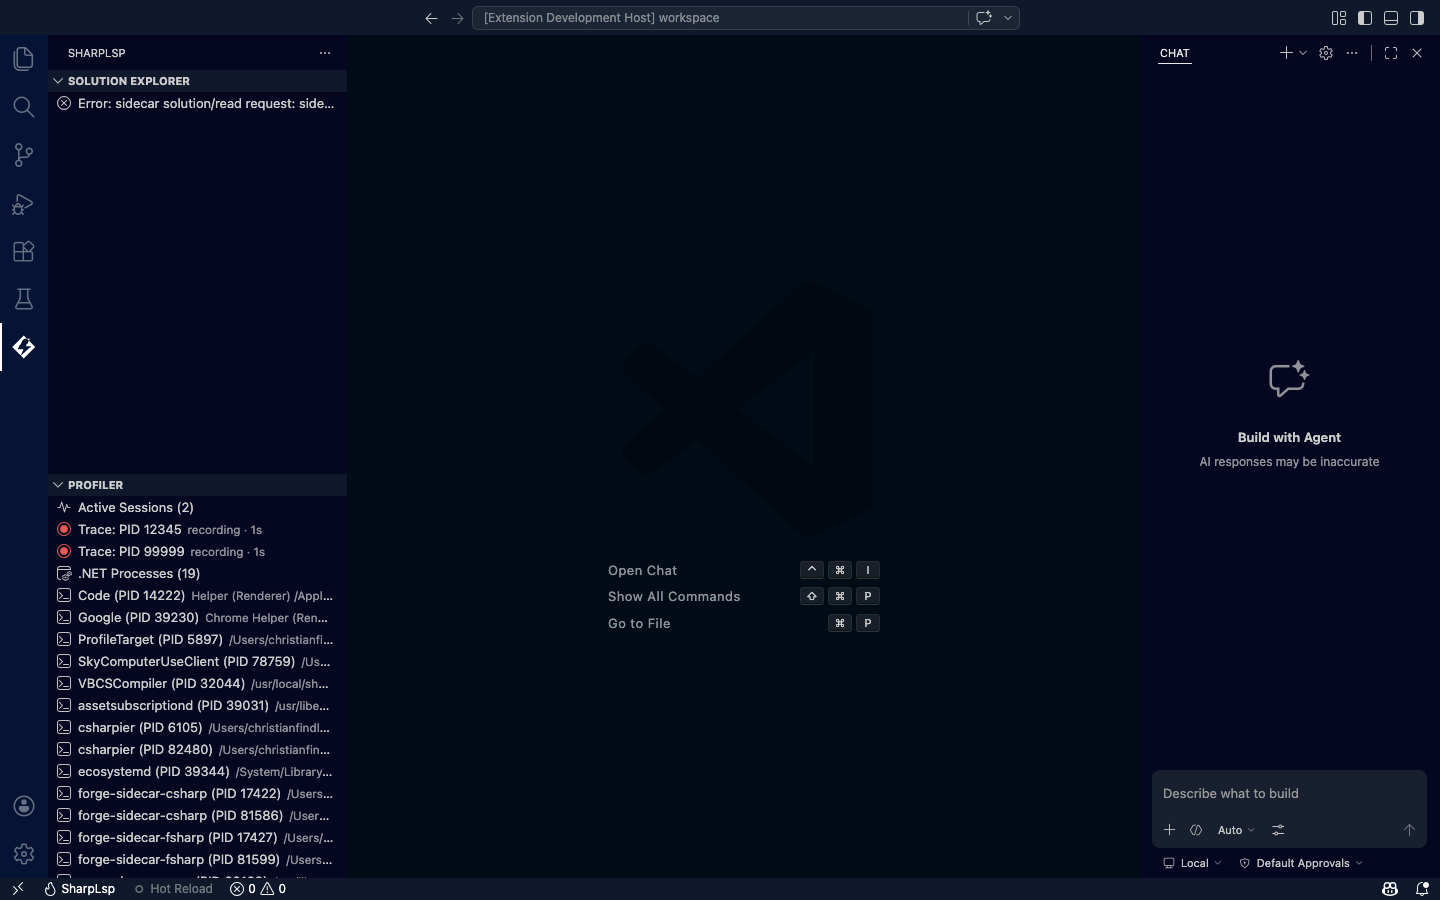
Profiler Tree View
The Profiler panel in the SharpLsp sidebar shows:
| Section | Content |
|---|---|
| Active Sessions | Running traces and counter monitors with session ID |
| .NET Processes | Discoverable processes with PID and command line |
Click Refresh to update the process list. The status bar shows the count of active profiling sessions.
Performance Tracing (dotnet-trace)
Capture detailed performance traces and view them in SpeedScope.
Start a Trace
- Open the Profiler view in the SharpLsp sidebar
- Run
SharpLsp: Start Tracefrom the command palette - Select a .NET process from the picker
- The trace session appears in the tree view
Stop a Trace
- Run
SharpLsp: Stop Tracefrom the command palette - Select the active trace session
- SharpLsp converts the
.nettraceto SpeedScope format and opens it in your browser automatically
Configuration
# sharplsp.toml
[profiler]
default_profile = "cpu-sampling"   # cpu-sampling | gc-verbose | gc-collect | none
default_format = "speedscope"      # speedscope | nettrace | chromium
default_duration = 0               # seconds; 0 = manual stop
max_sessions = 5
Live Counter Monitoring (dotnet-counters)
Monitor .NET performance counters in real time with a live-updating table.
Start Monitoring
- Run
SharpLsp: Start Countersfrom the command palette - Select a .NET process
- A webview panel opens showing live counter values updating in real time
Counter Display
| Column | Content |
|---|---|
| Provider | Counter provider (e.g., System.Runtime) |
| Counter | Counter display name |
| Value | Current value (formatted: bytes, counts, percentages) |
| Unit | Measurement unit |
Counters stream via sharplsp/profiler/counterUpdate LSP notifications. Run SharpLsp: Stop Counters to end the session.
Memory Dumps (dotnet-dump)
Capture and analyze memory dumps to investigate leaks and high memory usage.
Collect a Dump
- Run
SharpLsp: Collect Dumpfrom the command palette - Select a .NET process
- Choose dump type: Heap, Full, or Mini
- SharpLsp reports the output path and file size
Analyze Heap
- Run
SharpLsp: Analyze Heapfrom the command palette - Select a
.dmpfile - SharpLsp runs
dumpheap -statand displays a formatted table:
| Column | Content |
|---|---|
| Type Name | Fully qualified .NET type |
| Count | Number of instances on the heap |
| Total Size | Combined size (formatted as B/KB/MB) |
Heap Snapshot Diffing
Compare two heap dumps to identify growing types and memory leaks.
Compare Snapshots
- Run
SharpLsp: Compare Heap Snapshotsfrom the command palette - Select the baseline dump file (before exercising the suspected leak)
- Select the comparison dump file (after exercising)
- A diff panel opens showing:
| Column | Content |
|---|---|
| Type | .NET type name |
| Baseline Count / Current Count | Instance counts before and after |
| Count Delta | Change (+/-) |
| Baseline Size / Current Size | Memory sizes |
| Size Delta | Memory change (+/-) |
| Growth % | Percentage growth |
Click any row to open the Object Retention Graph for that type in the comparison dump.
Leak Suspects Table
Above the full diff, SharpLsp lists leak suspects automatically classified by severity:
| Severity | Criteria |
|---|---|
| 🔴 High | Count grew >100% AND size delta >1 MB |
| 🟡 Medium | Count grew >50% AND size delta >100 KB |
| 🟢 Low | Count grew >10% AND size delta >10 KB |
Known leak-prone types (EventHandler, CancellationTokenSource, Timer, delegates) are boosted to at least Low severity. Growing collections (List, Dictionary, arrays) are flagged as possible unbounded accumulation.
Automated Leak Detection
Run a guided baseline → exercise → compare workflow automatically.
- Run
SharpLsp: Detect Memory Leaks - Select a .NET process — SharpLsp collects the baseline dump
- Exercise the suspected leak path in your application
- SharpLsp collects the comparison dump and runs the full heap diff automatically
- The diff panel opens with suspects highlighted
Object Retention Graph
Visualize what objects are alive in a dump and what is holding them in memory.
Open the Graph
- Run
SharpLsp: Show Object Retention Graphfrom the command palette - Select a
.dmpfile - Enter the root object address (hex, e.g.
00007ff812345678) - An interactive force-directed graph renders in a webview panel
Or click any row in the Heap Diff panel to open the graph pre-loaded with the comparison dump.
Graph Controls
| Control | Action |
|---|---|
| Filter by type | Text input — hides nodes whose type name doesn't match |
| Depth slider | Limits nodes shown to those within N levels of the root |
| Export SVG | Downloads the current graph as an SVG file |
| Hover tooltip | Shows type, address, size, retained size, instance count |
Node Color Encoding
| Color | Meaning |
|---|---|
| 🔴 Red | Leak suspect or GC root with large retained size |
| 🟠 Orange | Large retained size (>1 MB) |
| 🔵 Blue | GC root (static field, thread stack, pinned, finalizer) |
| ⚫ Gray | Normal object |
Dashed border = GC root. Dashed edge = weak reference.
Object Inspection
- Run
SharpLsp: Inspect Objectfrom the command palette - Select a
.dmpfile and enter the object address - A text panel shows the object's type, size, generation, and all field values with reference addresses
Commands
| Command | Description |
|---|---|
SharpLsp: Refresh Profiler |
Refresh the .NET process list |
SharpLsp: List Processes |
Refresh and show .NET processes |
SharpLsp: Start Trace |
Begin a performance trace on a .NET process |
SharpLsp: Stop Trace |
Stop an active trace and open in SpeedScope |
SharpLsp: Start Counters |
Start live counter monitoring |
SharpLsp: Stop Counters |
Stop counter monitoring |
SharpLsp: Collect Dump |
Capture a memory dump |
SharpLsp: Analyze Heap |
Analyze heap statistics from a dump file |
SharpLsp: Compare Heap Snapshots |
Diff two heap dumps to find growing types |
SharpLsp: Detect Memory Leaks |
Guided baseline → exercise → compare workflow |
SharpLsp: Show Object Retention Graph |
Interactive object reference graph |
SharpLsp: Inspect Object |
Inspect a single object's fields and references |
Performance Targets
| Operation | Target |
|---|---|
| Process list refresh | <500ms |
| Trace start latency | <1s |
| Counter update delivery | <100ms from tool output to editor |
| Heap analysis (50k+ types) | <5s |
| GC root traversal | <10s |
| Object graph (depth 3, 200 nodes) | <3s |
| Object graph (depth 5, 200 nodes) | <8s |
| Heap diff (two 50k-type dumps) | <10s |
| Graph webview initial render | <500ms |
Error Handling
All profiler commands handle errors gracefully:
- Tool not installed: Returns an error with the exact
dotnet tool installcommand - Invalid PID: Returns an error without crashing the LSP server
- Missing dump file: Returns a clear error message
- Session limit exceeded: Returns an error when max concurrent sessions is reached
- Sidecar independence: Profiler runs entirely in the Rust host; sidecar crashes do not affect profiling